Data Preprocessing Steps and Inspiration
Choosing the Algorithm for the Project
Future Possibilities of the Project
This project aims to predict customer attrition for a telecom company using various machine learning algorithms. The focus is on developing models that can accurately identify customers who are likely to leave based on their historical data.
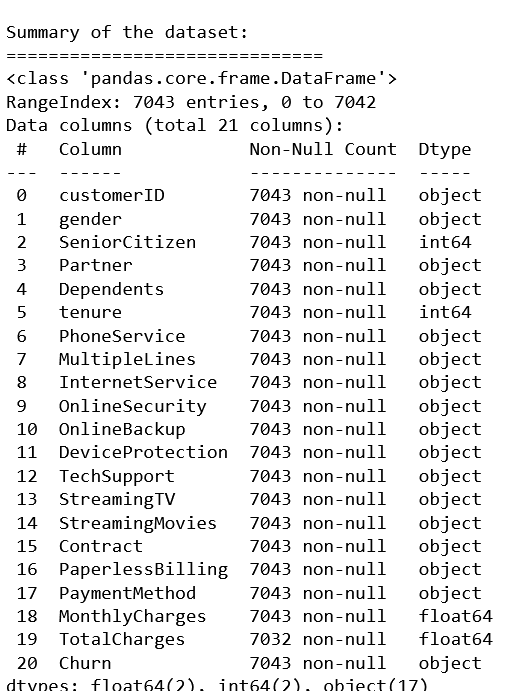
The dataset used in this project contains customer information, including demographic details, service usage patterns, and historical behavior. The data is sourced from a CSV file. The dataset has 7043 rows and 21 columns.
-
customerID: Unique identifier for each customer.
-
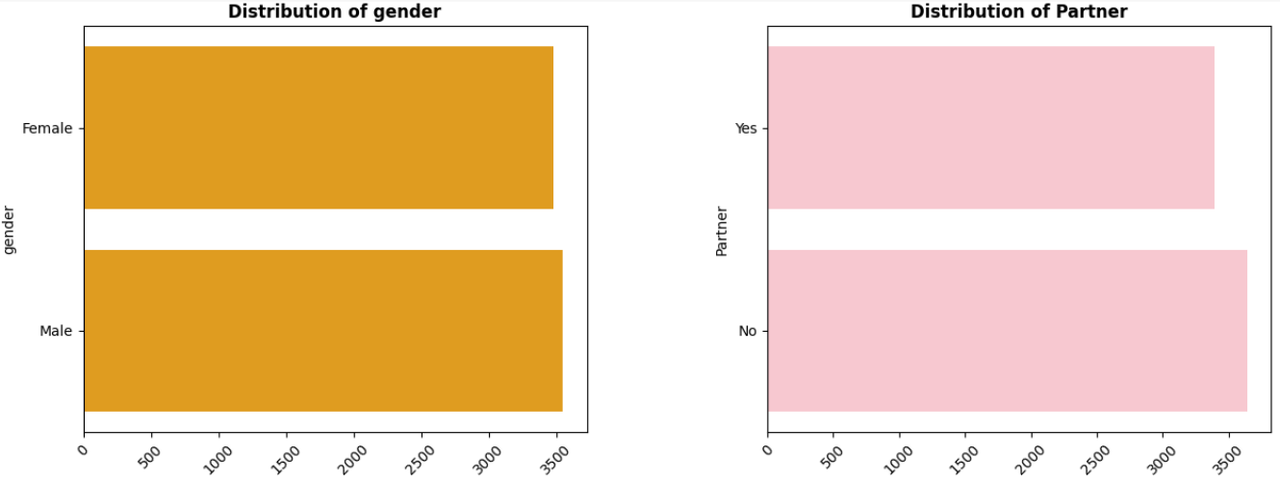
gender: Gender of the customer.
-
SeniorCitizen: Indicates if the customer is a senior citizen (1) or not (0).
-
Partner: Indicates if the customer has a partner (Yes/No).
-
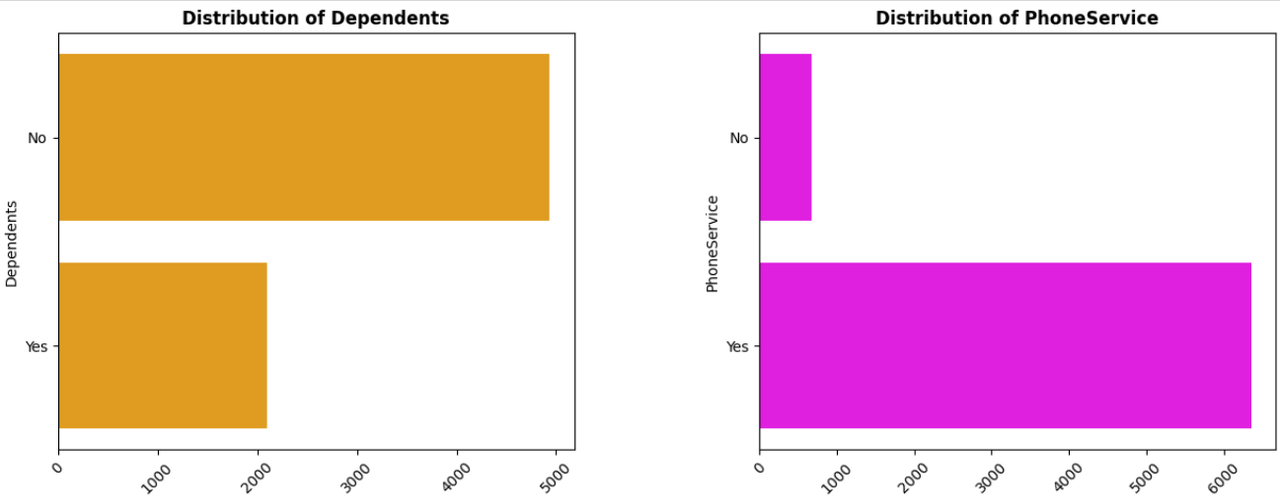
Dependents: Indicates if the customer has dependents (Yes/No).
-
tenure: Number of months the customer has stayed with the company.
-
PhoneService: Indicates if the customer has phone service (Yes/No).
-
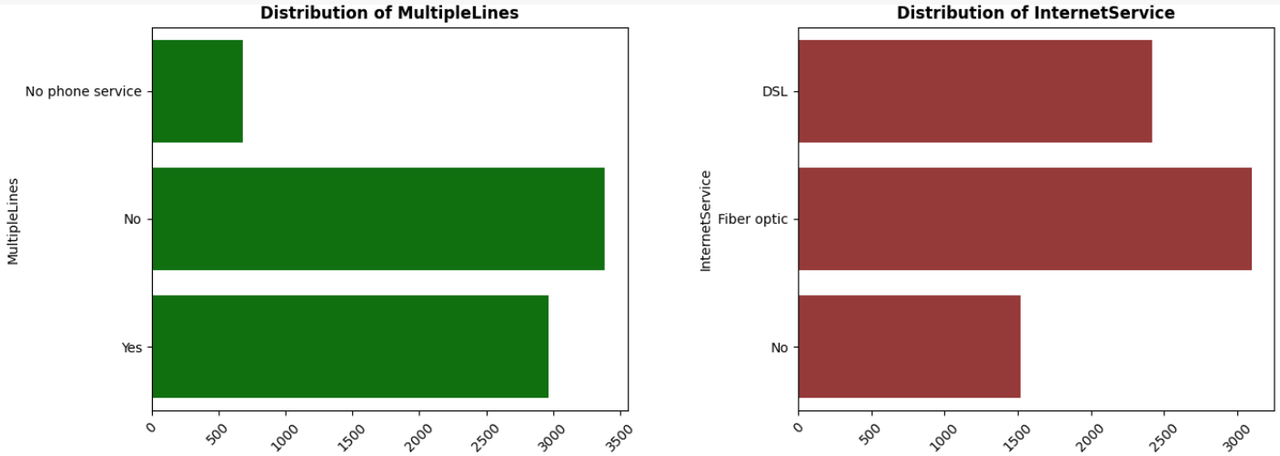
MultipleLines: Indicates if the customer has multiple lines (Yes/No, No phone service).
-
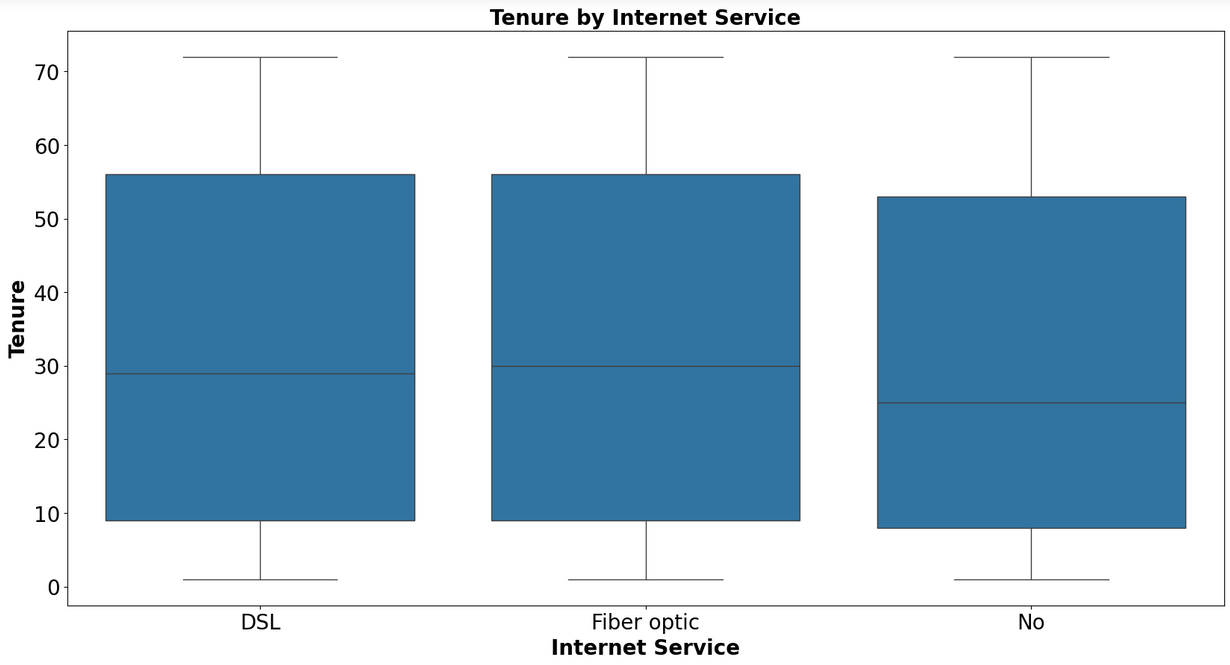
InternetService: Type of internet service (DSL, Fiber optic, No).
-
OnlineSecurity: Indicates if the customer has online security (Yes/No, No internet service).
-
OnlineBackup: Indicates if the customer has online backup (Yes/No, No internet service).
-
DeviceProtection: Indicates if the customer has device protection (Yes/No, No internet service).
-
TechSupport: Indicates if the customer has tech support (Yes/No, No internet service).
-
StreamingTV: Indicates if the customer has streaming TV (Yes/No, No internet service).
-
StreamingMovies: Indicates if the customer has streaming movies (Yes/No, No internet service).
-
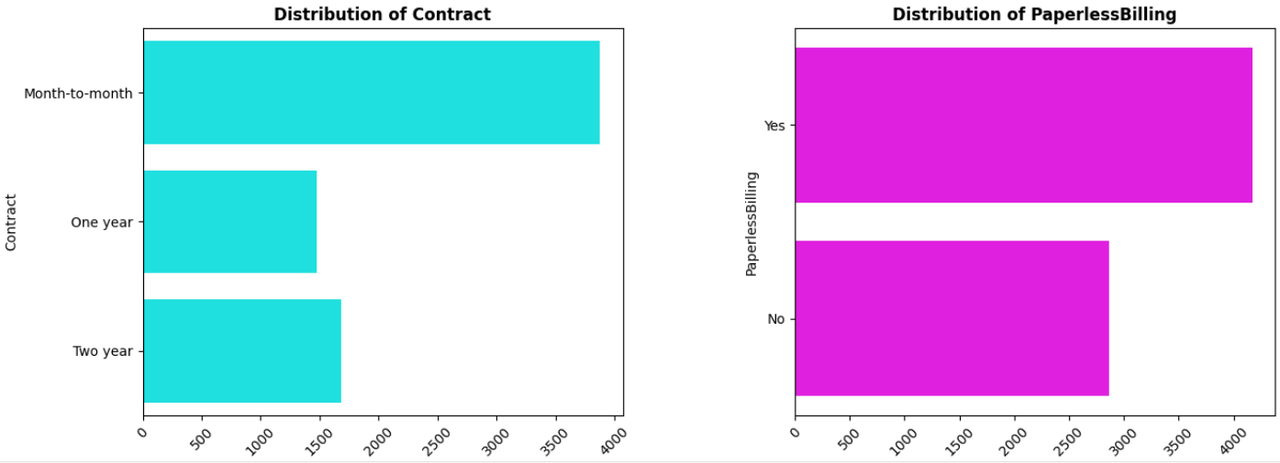
Contract: Type of contract (Month-to-month, One year, Two year).
-
PaperlessBilling: Indicates if the customer has paperless billing (Yes/No).
-
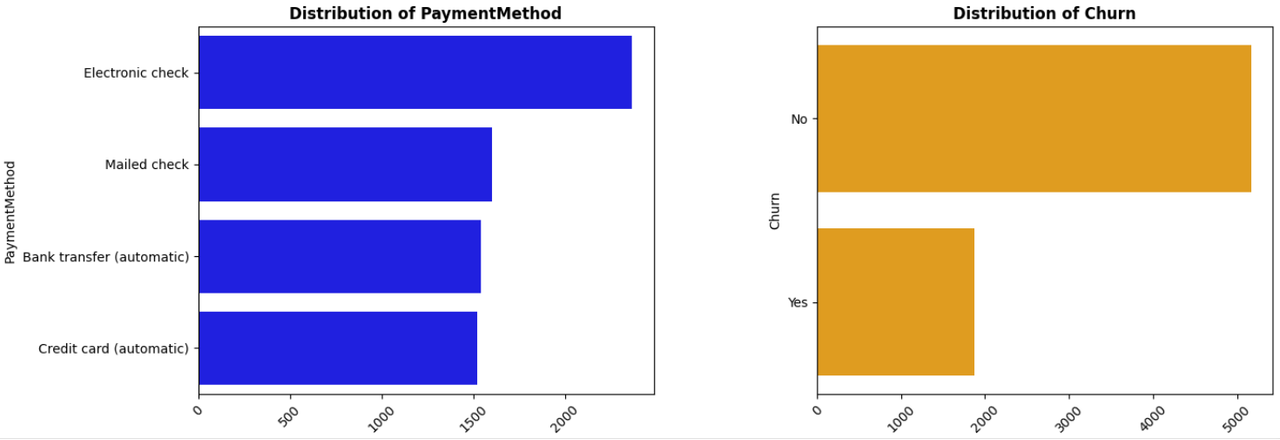
PaymentMethod: Payment method (Electronic check, Mailed check, Bank transfer (automatic), Credit card (automatic)).
-
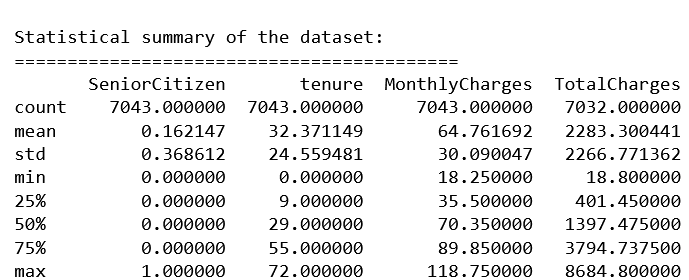
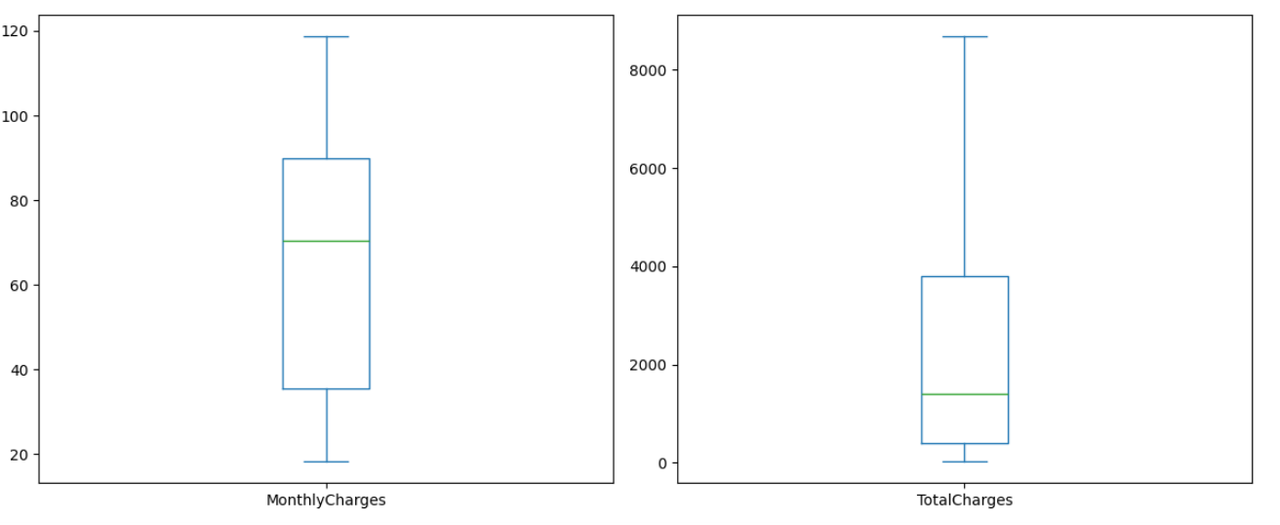
MonthlyCharges: The amount charged to the customer monthly.
-
TotalCharges: The total amount charged to the customer.
-
Churn: Indicates if the customer has churned (Yes/No).
-
Python: Data Cleaning and Analysis
-
Jupyter Notebook: For interactive data analysis and visualization
Libraries
Below are the links for details and commands (if required) to install the necessary Python packages:
- pandas: Go to Pandas Installation or use command:
pip install pandas - numpy: Go to NumPy Installation or use command:
pip install numpy - matplotlib: Go to Matplotlib Installation or use command:
pip install matplotlib - seaborn: Go to Seaborn Installation or use command:
pip install seaborn - scikit-learn: Go to Scikit-Learn Installation or use command:
pip install scikit-learn - XGBoost: Go to XGBoost Installation or use command: pip install xgboost
- Imbalanced-learn: Go to Imbalanced-learn Installation or use command: pip install imbalanced-learn
- Data loading and initial exploration
- Data cleaning and manipulation
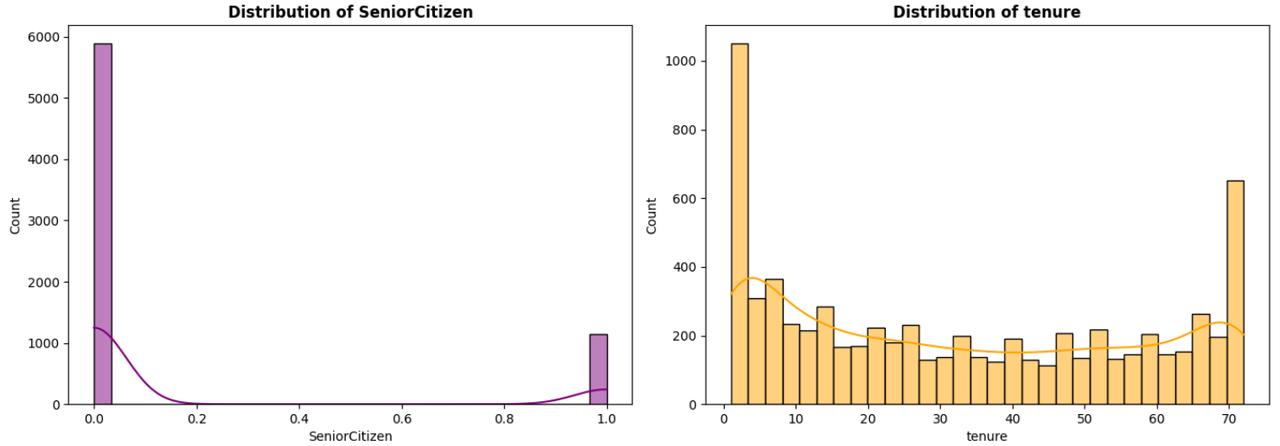
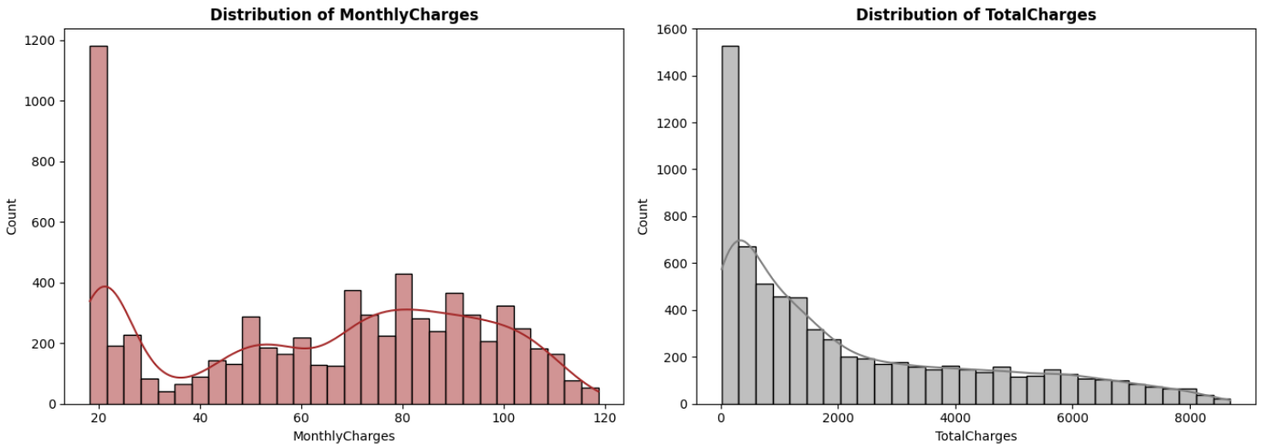
- Data visualization to understand feature distributions and relationships
- Identifying and handling missing values
- Checking for data imbalances
- Handling Missing Values: Missing values in the 'TotalCharges' column were converted to numeric and missing entries were removed.
- Encoding Categorical Variables: Label encoding was applied to convert categorical variables into numeric format.
- SMOTE (Synthetic Minority Over-sampling Technique): It is used to address class imbalance by generating synthetic samples for the minority class, thus balancing the class distribution
- Scaling Numerical Features: StandardScaler was used to standardize numerical features.
- Splitting the Dataset: The dataset was split into training and testing sets using train_test_split.
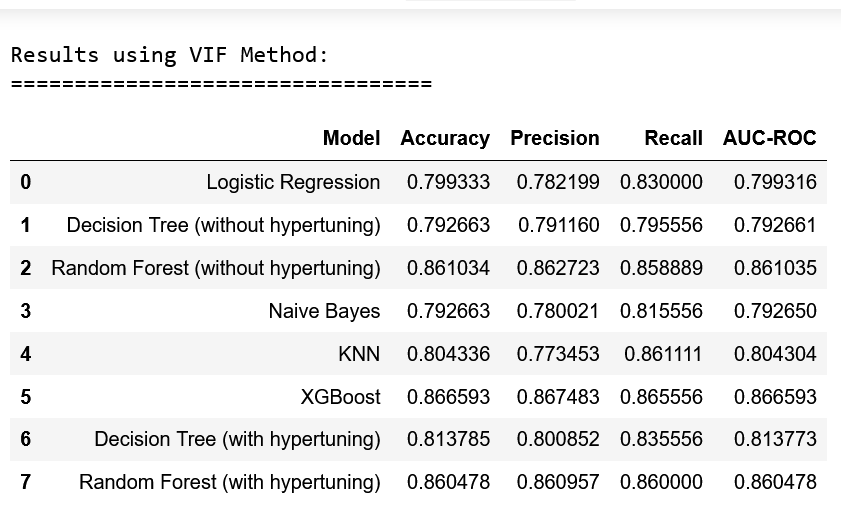
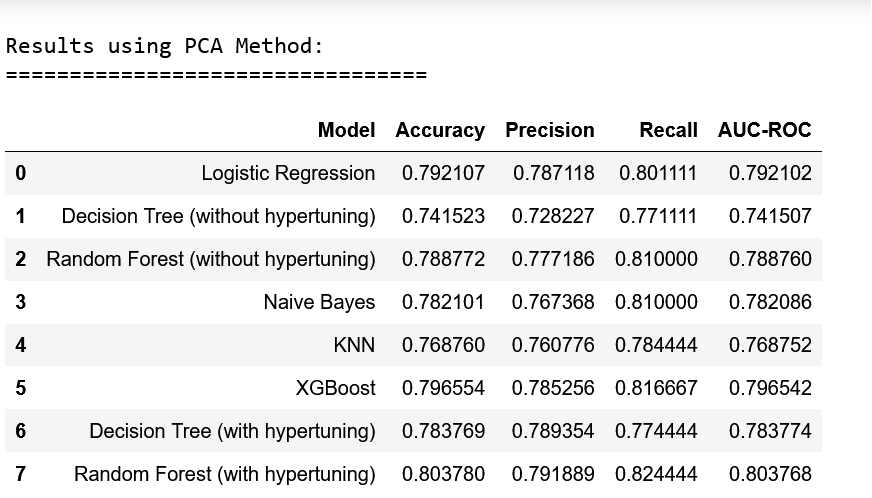
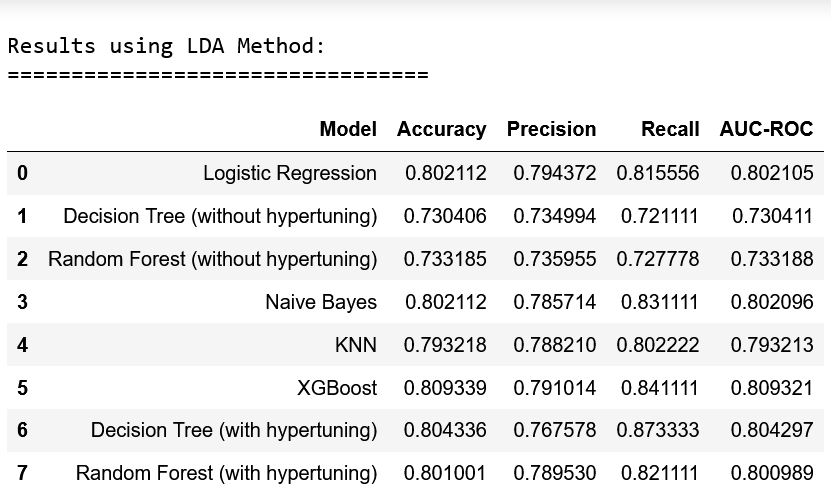
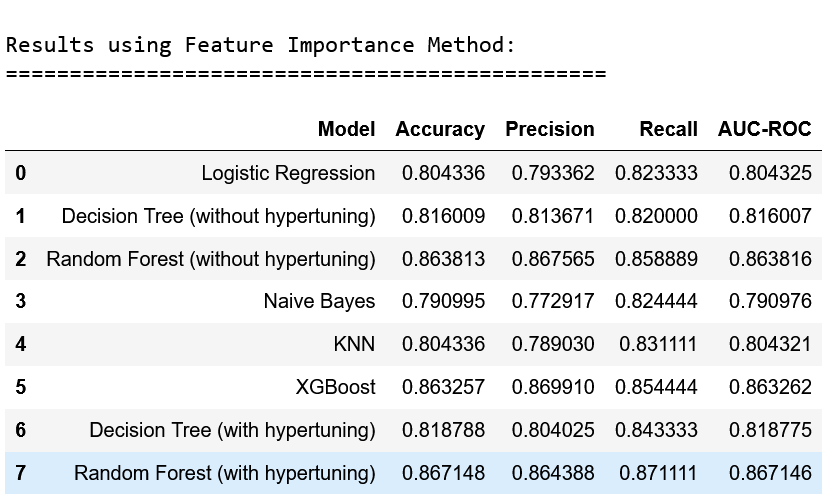
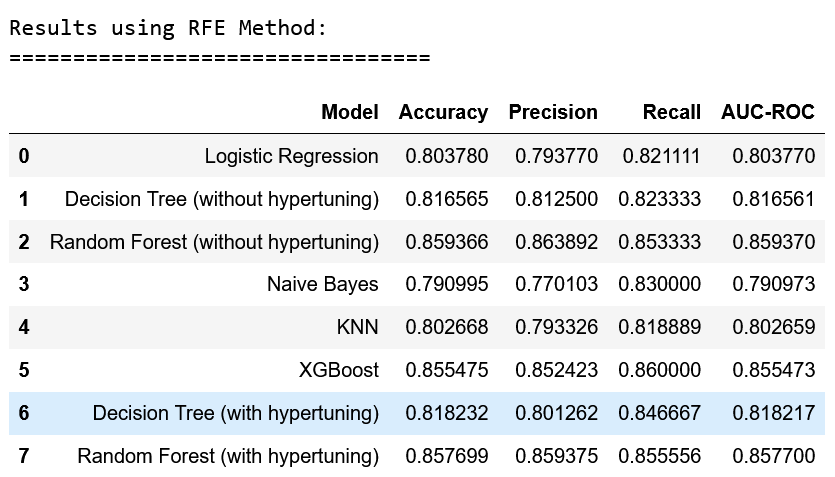
- Feature Selection Techniques: o PCA (Principal Component Analysis): Reduces dimensionality by transforming features into a set of linearly uncorrelated components. o LDA (Linear Discriminant Analysis): Maximizes separability between classes by projecting data in a lower-dimensional space. o RFE (Recursive Feature Elimination): Selects features by recursively considering smaller sets and pruning the least important ones. o VIF (Variance Inflation Factor): Identifies multicollinearity among features. Features with high VIF values were removed to improve model performance. o Feature Importance: Feature importance methods help identify which features in a dataset contribute the most to the predictive power of a machine learning model.
-
Histograms and bar charts for feature distributions
-
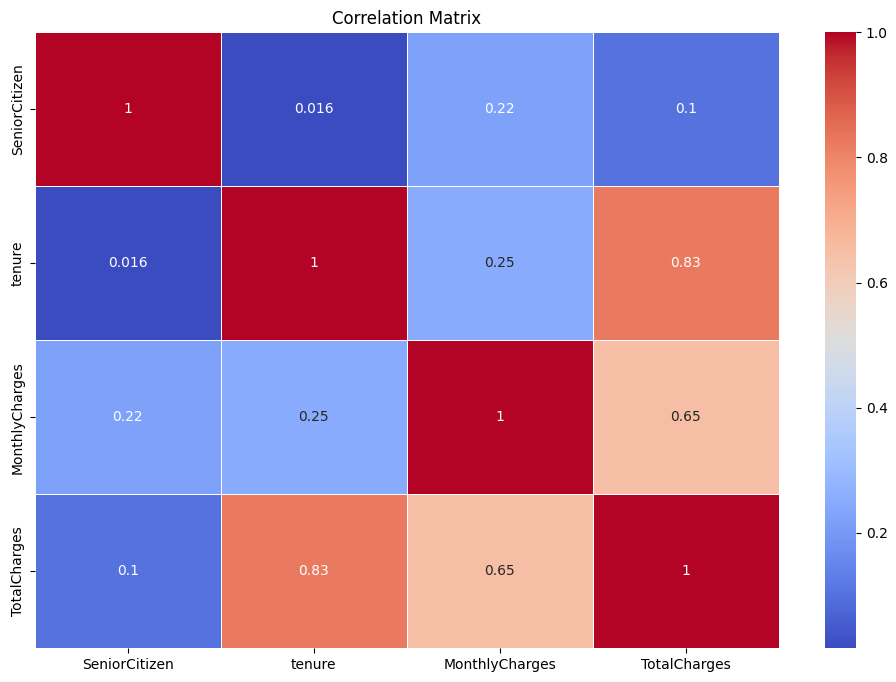
Correlation heatmap to identify relationships between features
-
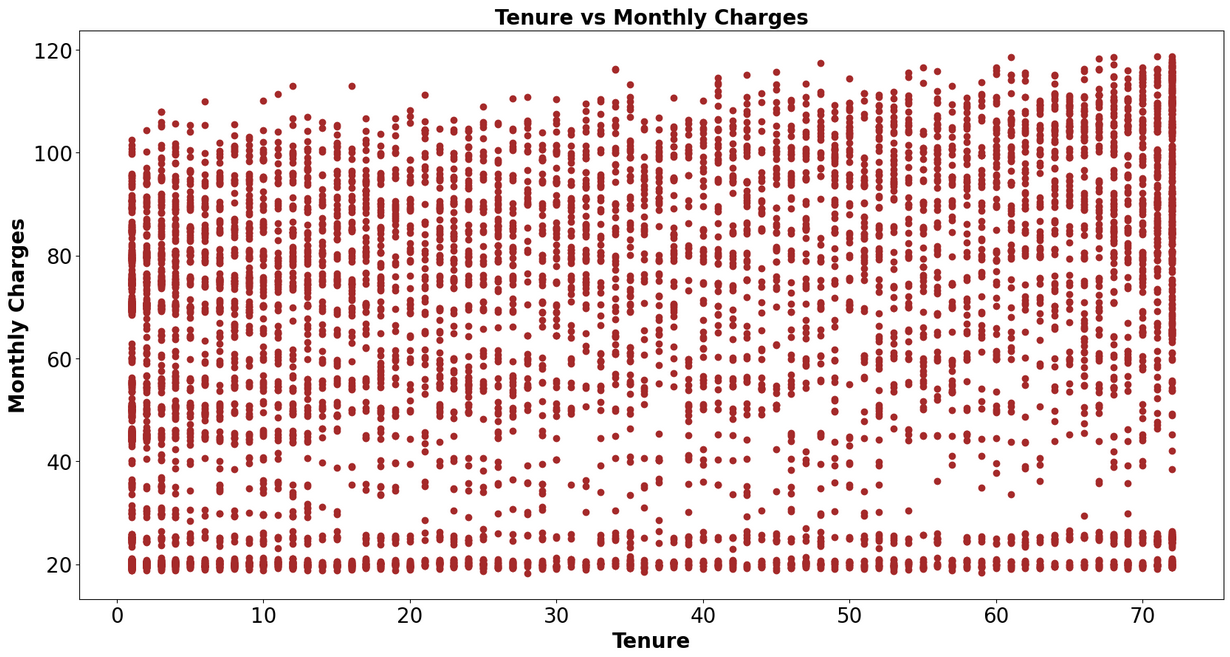
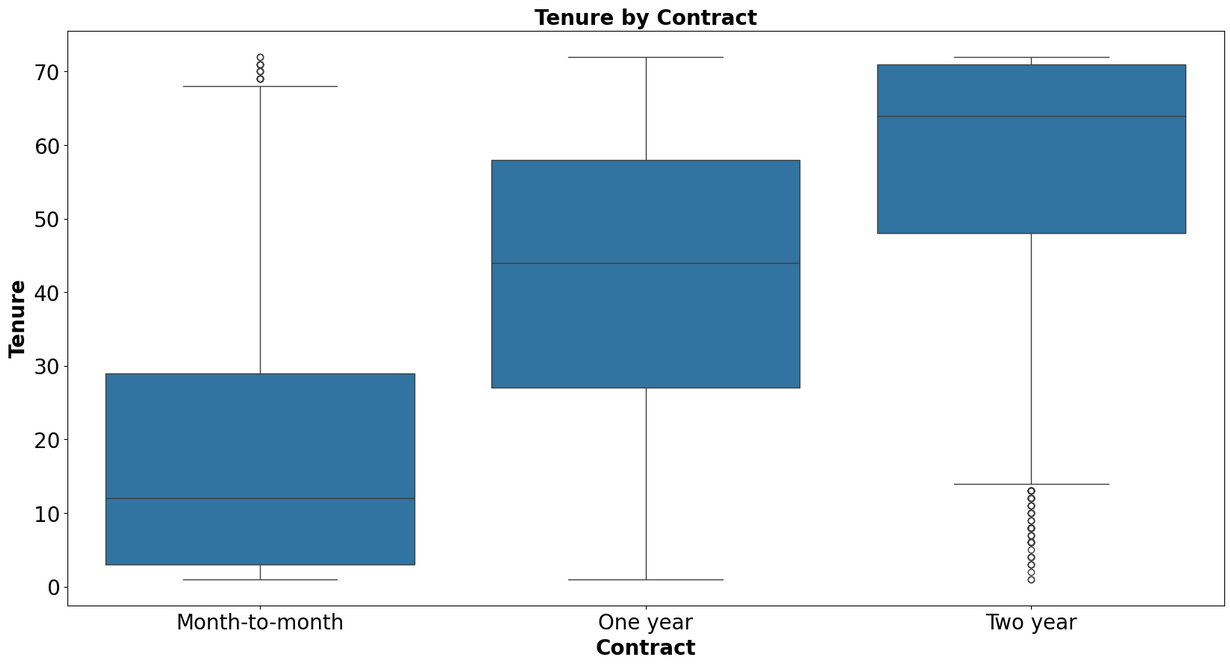
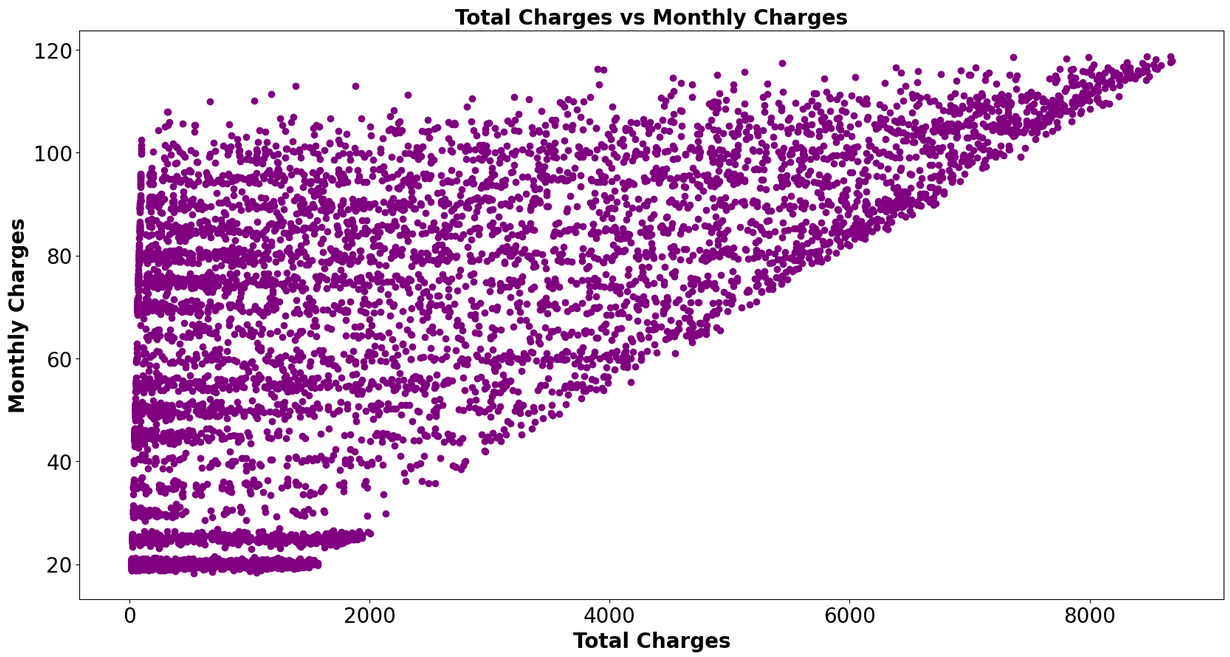
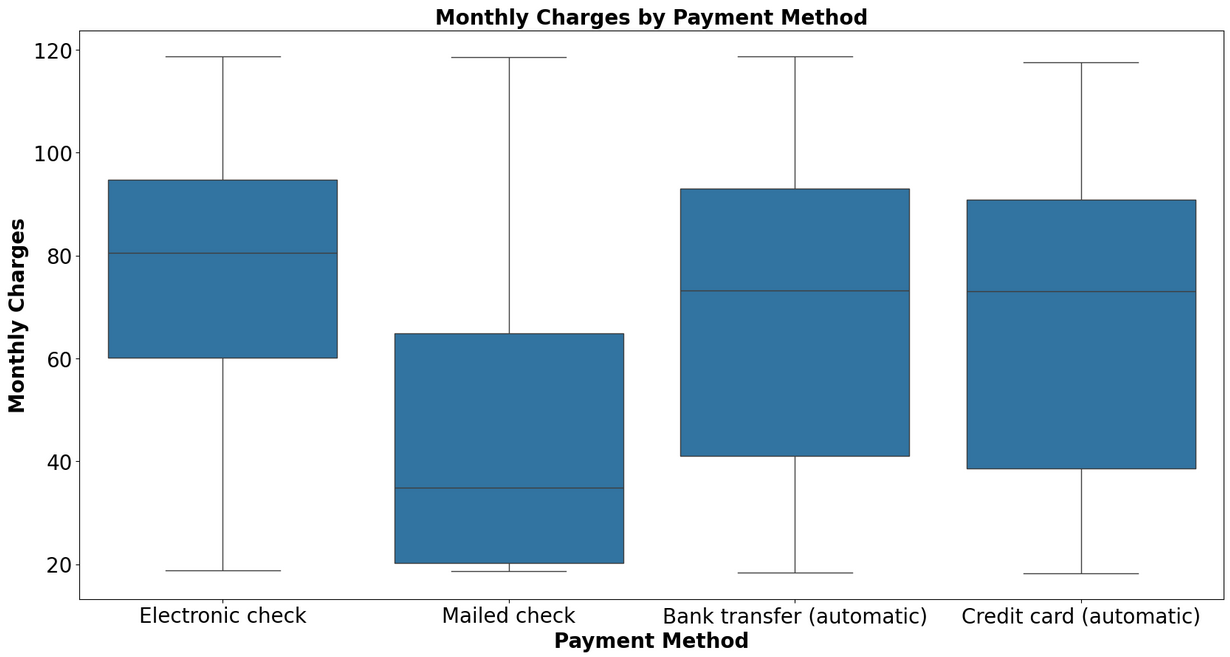
Box Plots and Scatter Plots to visualize relationships between multiple features
-
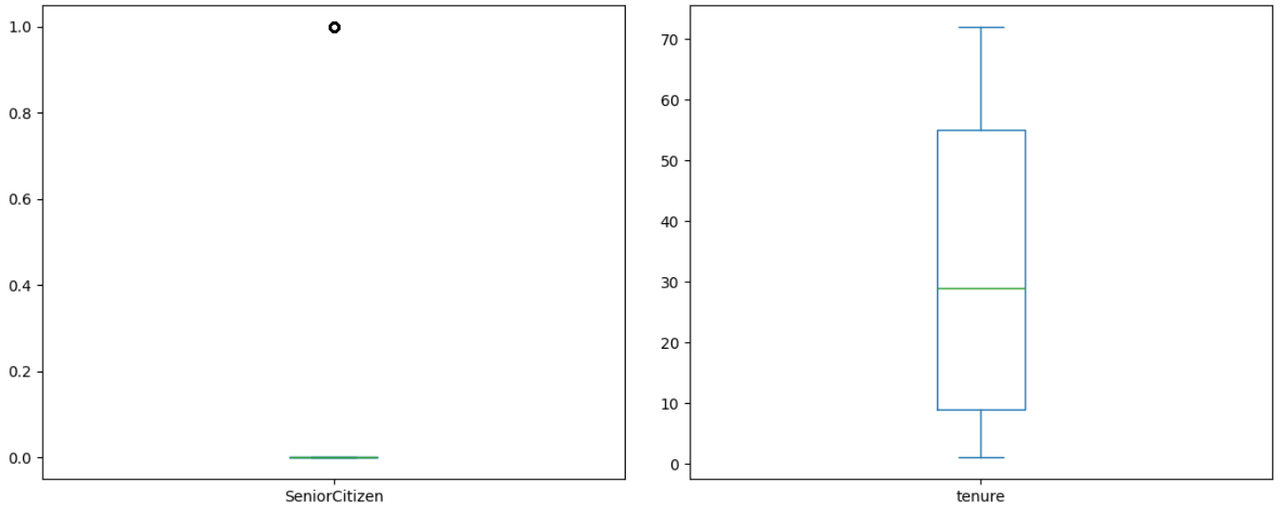
Box plots to identify outliers
- Logistic Regression: A statistical model that estimates the probability of a binary outcome based on one or more predictor variables.
- Decision Tree Classifier: A tree-like model used to make decisions based on the features of the data.
- Random Forest Classifier: An ensemble method that creates a forest of decision trees and outputs the mode of their predictions.
- K-Neighbors Classifier (KNN): A simple, instance-based learning algorithm that assigns class labels based on the majority vote of its neighbors.
- Naive Bayes Classifier: A probabilistic classifier based on applying Bayes' theorem with strong independence assumptions.
- XGBoost Classifier: An optimized gradient boosting library designed to be highly efficient and flexible.
- The dataset provided is representative of the customer base.
- All relevant features are included in the dataset.
- The preprocessing steps adequately prepare the data for modeling.
- Accuracy: The ratio of correctly predicted instances to the total instances.
- Precision: The ratio of correctly predicted positive observations to the total predicted positives.
- Recall: The ratio of correctly predicted positive observations to all observations in the actual class.
- ROC-AUC Score: A performance measurement for classification problems at various threshold settings.
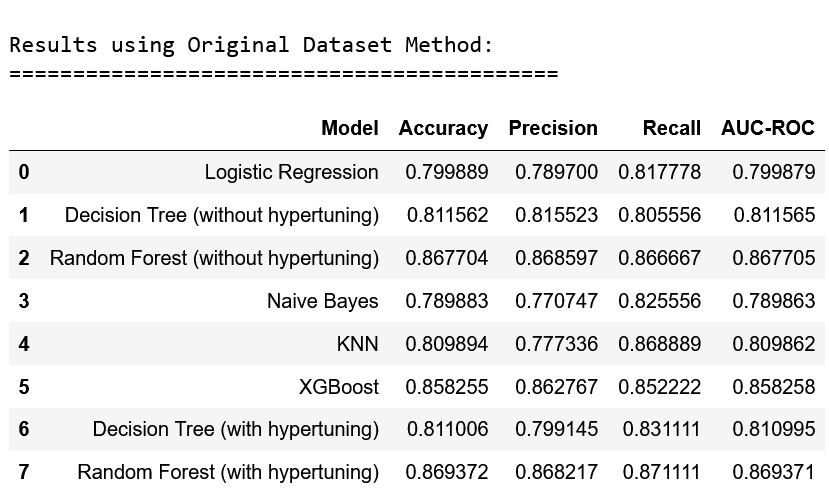
After analyzing the metrics for all the models and feature extraction methods, the overall best model was determined to be the Random Forest Classifier (after hypertuning) without any feature extraction(on the original dataset). The metrics of this model are below:
- Accuracy: 86.94%
- Precision: 86.82%
- Recall: 87.11%
- AUC-ROC Score: 86.93%
- Further data collection and feature engineering could improve model performance.
- Regularly updating the model with new data can help maintain accuracy over time.
- Implementing retention strategies based on model predictions to reduce attrition.
- The dataset may contain biases that could affect the model's predictions.
- The models' performance is limited by the quality and quantity of the available data.
- Exploring additional algorithms and ensemble methods
- Implementing deep learning models for better performance
- Automating the model updating process with new incoming data
- Developing real-time attrition prediction systems