A set of collectd plugins monitoring and publishing metrics for Ceph components.
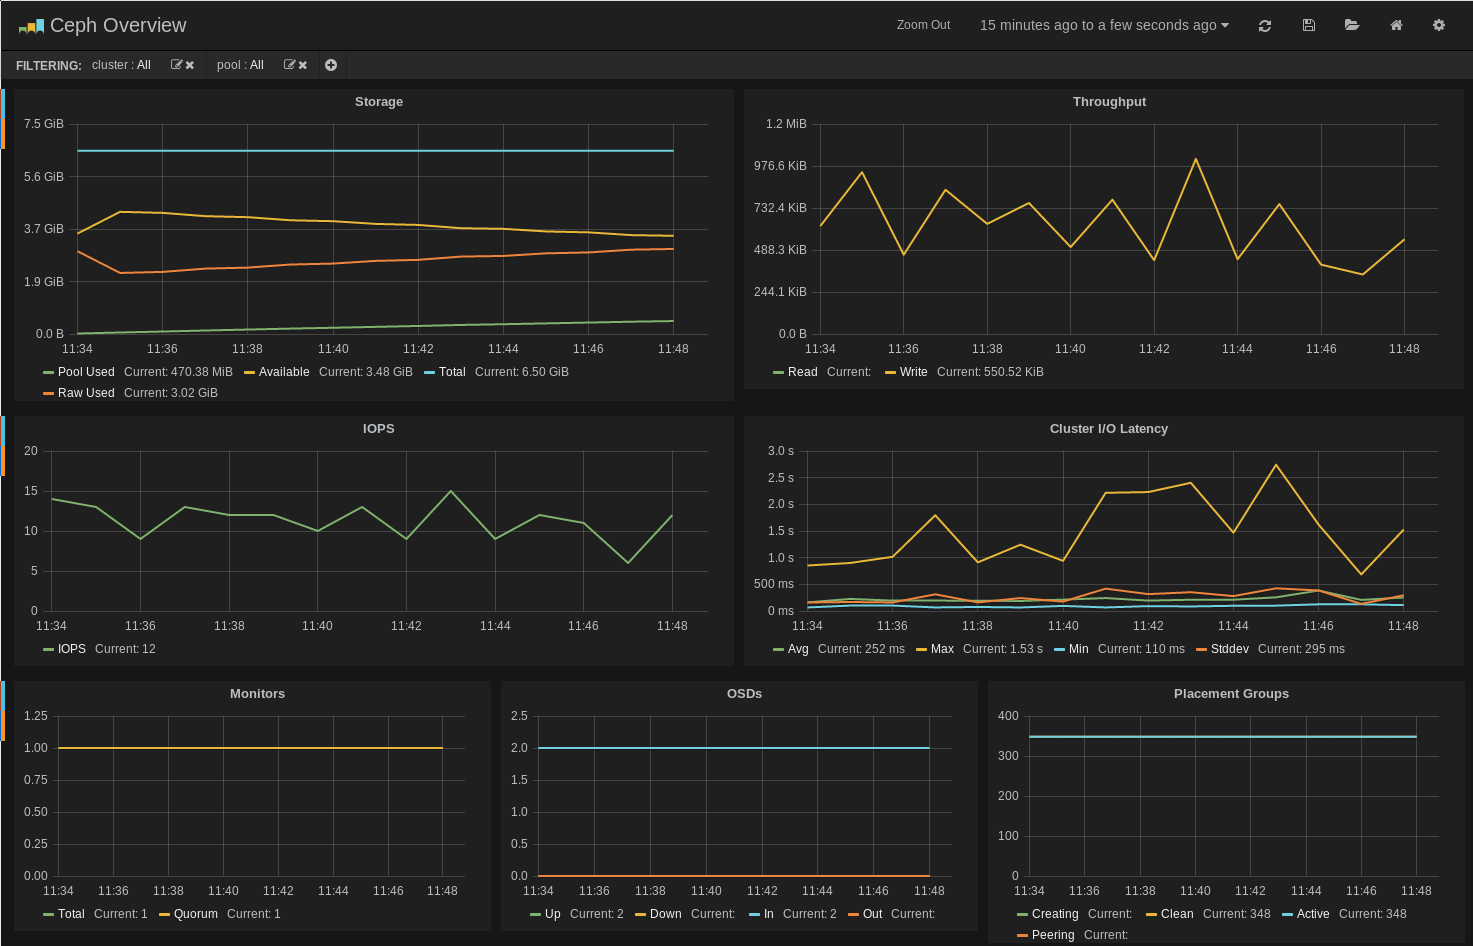
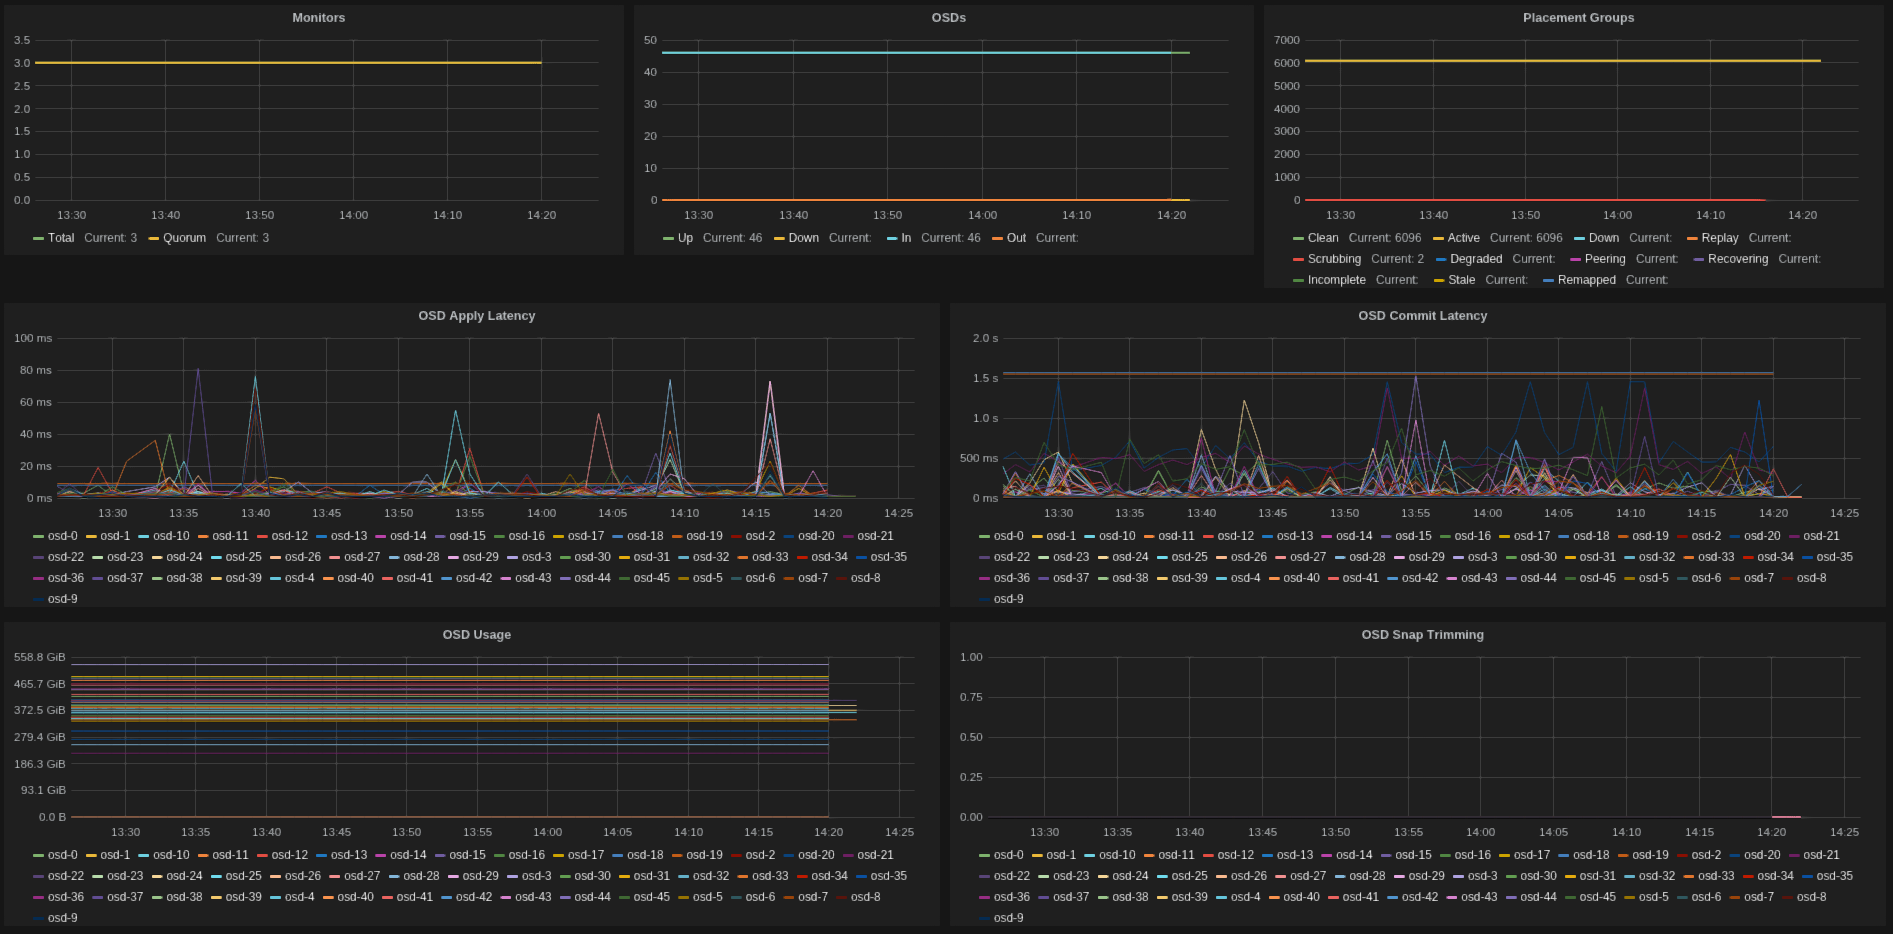
Sample Grafana dashboard displaying common metrics from the plugins.
Check here for the dashboard definition.
There are several plugins, usually mapping to the ceph command line tools.
Find below a list of the available plugins and the metrics they publish.
- ceph_monitor_plugin
- ceph-<cluster>.mon.gauge.number (total number of monitors)
- ceph-<cluster>.mon.gauge.quorum (number of monitors in quorum)
- ceph_osd_plugin
- ceph-<cluster>.osd.gauge.up (number of osds 'up')
- ceph-<cluster>.osd.gauge.down (number of osds 'down')
- ceph-<cluster>.osd.gauge.in (number of osds 'in')
- ceph-<cluster>.osd.gauge.out (number of osds 'out')
- ceph_pool_plugin
- ceph-<cluster>.pool-<name>.gauge.read_bytes_sec (per pool read bytes/sec)
- ceph-<cluster>.pool-<name>.gauge.write_bytes_sec (per pool write bytes/sec)
- ceph-<cluster>.pool-<name>.gauge.op_per_sec (per pool iops)
- ceph-<cluster>.pool-<name>.gauge.bytes_used (per pool bytes used)
- ceph-<cluster>.pool-<name>.gauge.kb_used (per pool KBytes used)
- ceph-<cluster>.pool-<name>.gauge.objects (per pool number of objects)
- ceph-<cluster>.cluster.gauge.total_avail (cluster space available)
- ceph-<cluster>.cluster.gauge.total_space (cluster total raw space)
- ceph-<cluster>.cluster.gauge.total_used (cluster raw space used)
- ceph_pg_plugin
- ceph-<cluster>.pg.gauge.<state> (number of pgs in <state>)
- ceph-<cluster>.osd-<id>.gauge.fs_commit_latency (fs commit latency for osd)
- ceph-<cluster>.osd-<id>.gauge.apply_commit_latency (apply commit latency for osd)
- ceph-<cluster>.osd-<id>.gauge.kb_used (kb used by osd)
- ceph-<cluster>.osd-<id>.gauge.kb (total space of osd)
- ceph_latency_plugin
- ceph-<cluster>.cluster.gauge.avg_latency (avg cluster latency)
- ceph-<cluster>.cluster.gauge.max_latency (max cluster latency)
- ceph-<cluster>.cluster.gauge.min_latency (min cluster latency)
- ceph-<cluster>.cluster.gauge.stddev_latency (stddev of cluster latency)
It assumes an existing installation of collectd - check docs for details.
If you want to publish to graphite, configure the write_graphite collectd plugin.
And you might want the awesome grafana too, which provides awesome displays.
The example configuration(s) below assume the plugins to be located under /usr/lib/collectd/plugins/ceph.
If you're under ubuntu, consider installing from this ppa.
Each plugin should have its own config file, under /etc/collectd/conf.d/<pluginname>.conf, which
should follow something similar to:
# cat /etc/collectd/conf.d/ceph_pool.conf

<LoadPlugin "python">
    Globals true
</LoadPlugin>

<Plugin "python">
    ModulePath "/usr/lib/collectd/plugins/ceph"

    Import "ceph_pool_plugin"

    <Module "ceph_pool_plugin">
        Verbose "True"
        Cluster "ceph"
        Interval "60"
        TestPool "test"
    </Module>
</Plugin>
If you use puppet for configuration, then try this excelent collectd module.
It has plenty of docs on how to use it, but for our specific plugins:
  collectd::plugin::python { 'ceph_pool':
    modulepath => '/usr/lib/collectd/plugins/ceph',
    module     => 'ceph_pool_plugin',
    config     => {
      'Verbose'  => 'true',
      'Cluster'  => 'ceph',
      'Interval' => 60,
      'TestPool' => 'test',
    },
  }
Check this repo for a nice docker setup to run collectd-ceph (thanks to Ian Babrou).
The debian packaging files are provided, but not yet available in the official repos.
All contributions more than welcome, just send pull requests.
GPLv2 (check LICENSE).
Ricardo Rocha [email protected]
Please log tickets and issues at the github home.
Some handy instructions on how to build for ubuntu.

