Squid helps you write Ruby code to draw graphs in PDF files.
The source code is available on GitHub and the documentation on RubyDoc.
Prawn is a great Ruby library to generate PDF files but lacks high-level components to draw graphs.
Squid adds a single method chart(data = {}, options = {}) to Prawn.
Provide the data to plot as a hash, with each key/value representing a series.
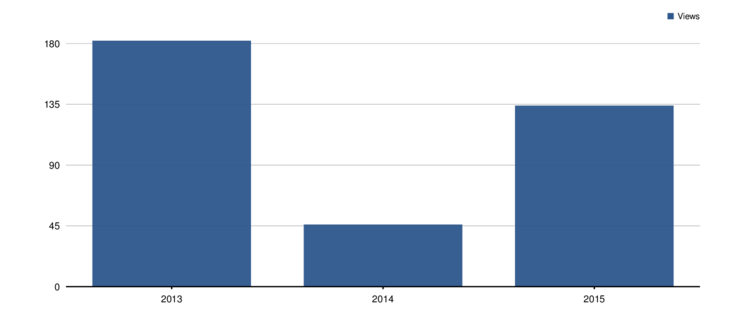
For instance, the following code generates the graph below:
data = {views: {2013 => 182, 2014 => 46, 2015 => 134}}
chart dataAll the settings available for the chart method are detailed on the Squid homepage:
Please proceed to http://fullscreen.github.io/squid for more details and examples.
Squid requires Ruby 2.2 or higher. If used in a Rails project, requires Rails 4.0 or higher.
To include in your project, add gem 'squid', '~> 1.4' to the Gemfile file of your Ruby project.
rake manual
If you’ve made it this far in the README… thanks! ✌️ Feel free to try it the gem, explore the code, and send issues or pull requests.
All pull requests will have to make Travis and Code Climate happy in order to be accepted. 😙
You can also run the tests locally with bundle exec rspec.
Happy hacking!


