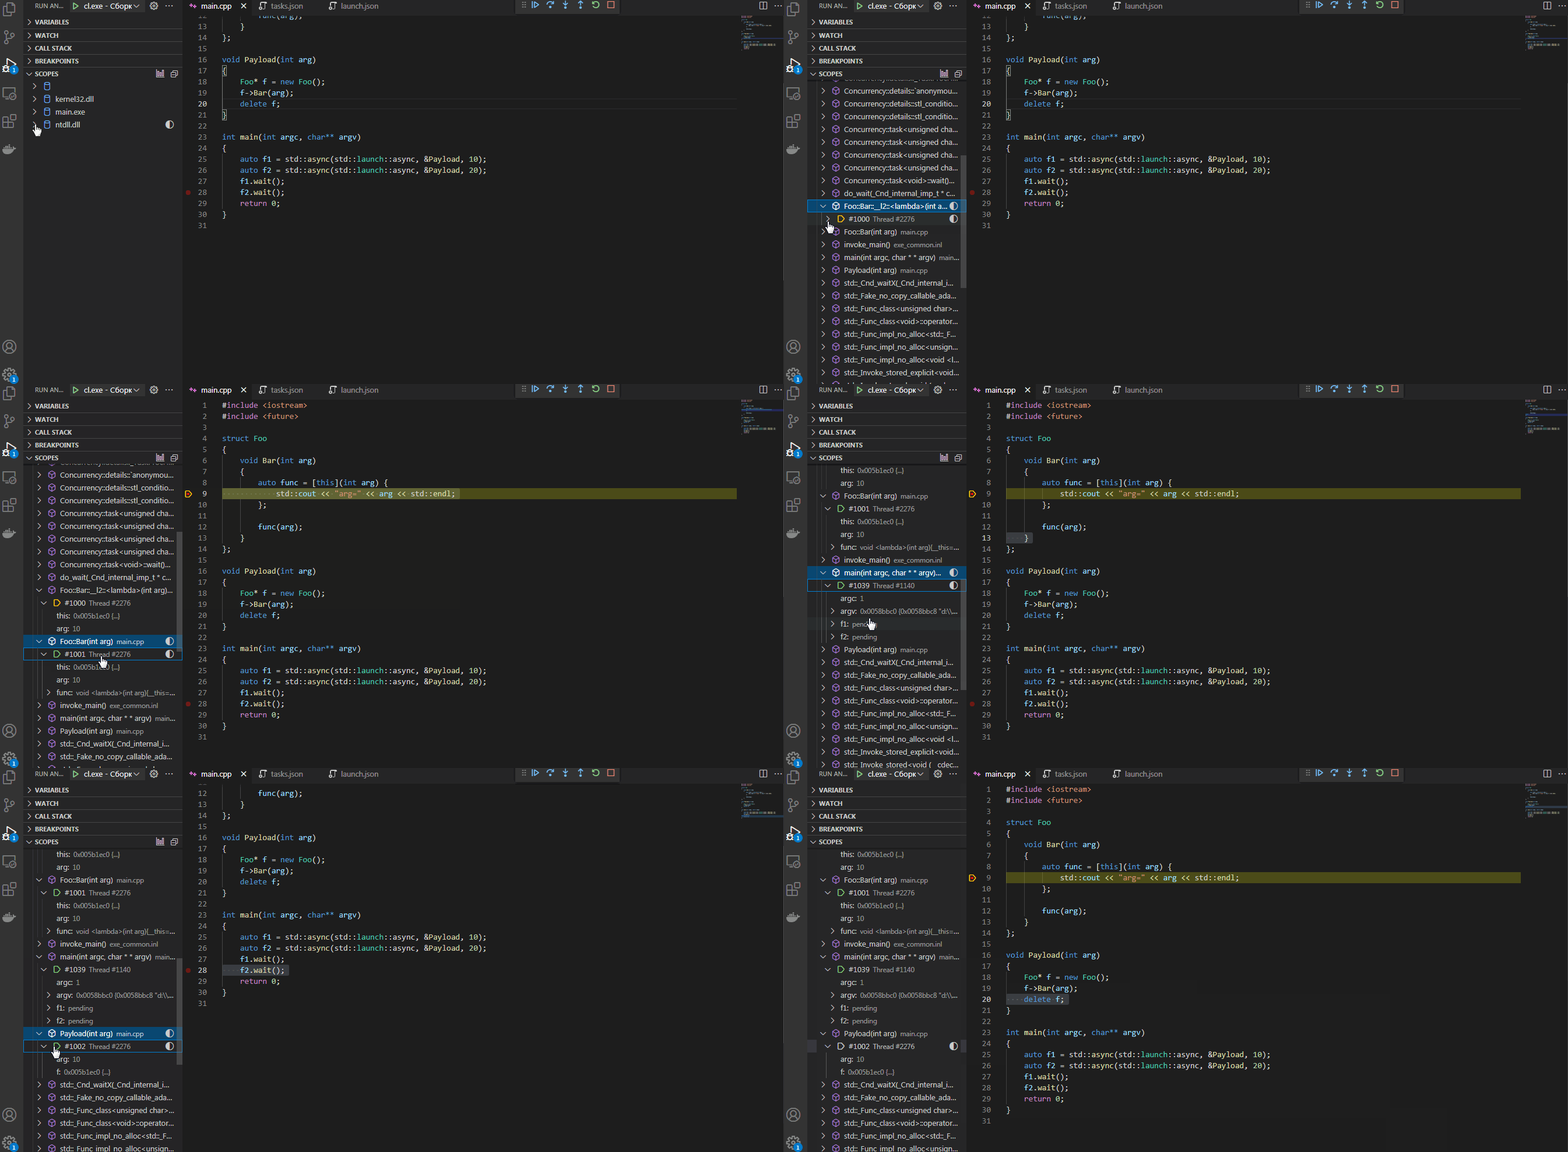
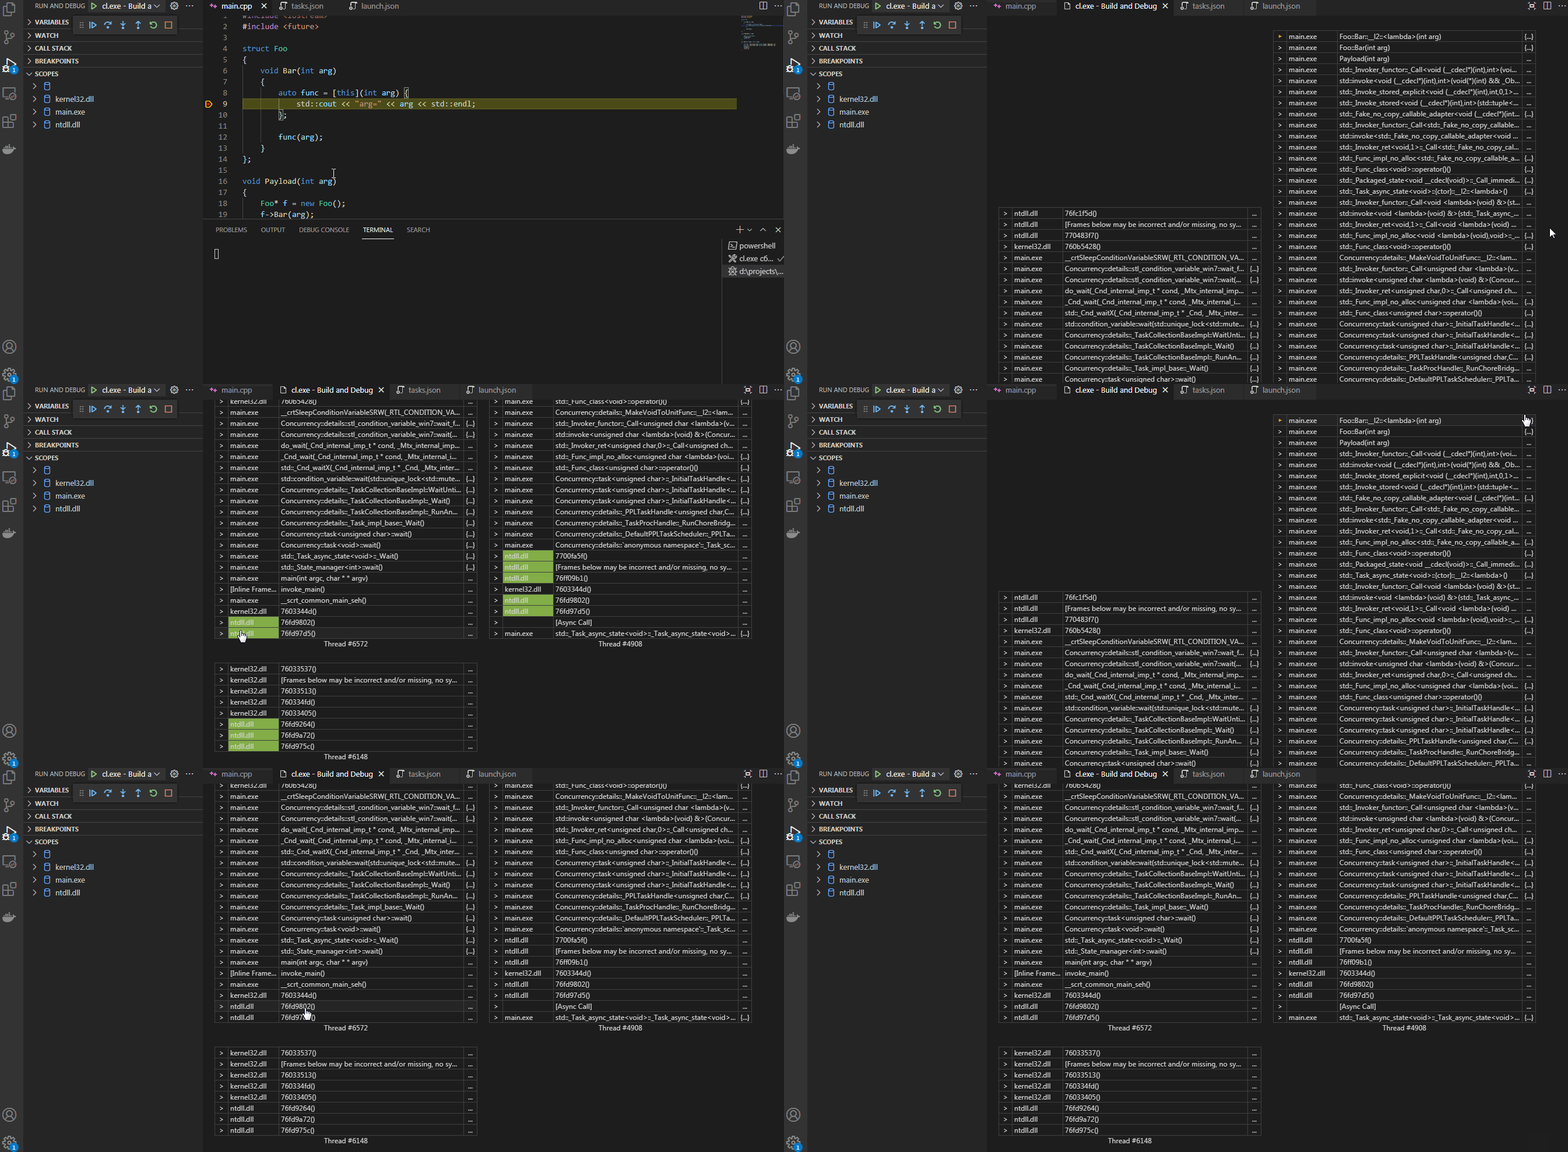
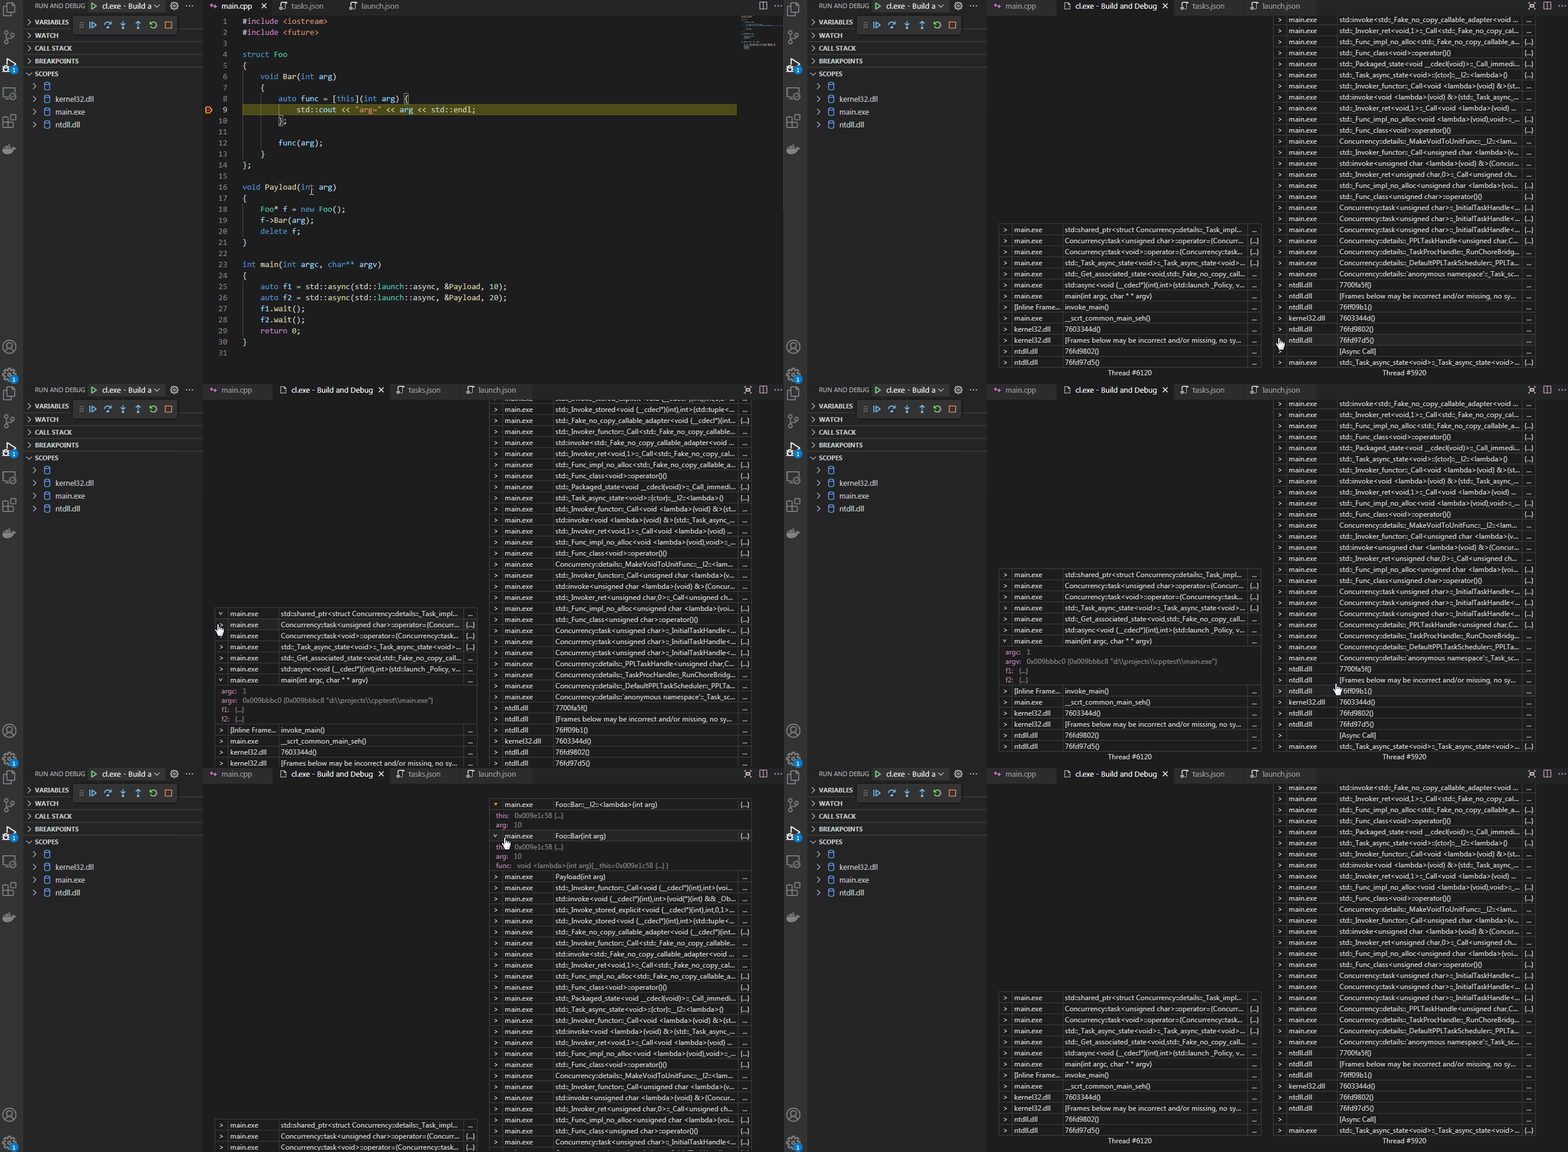
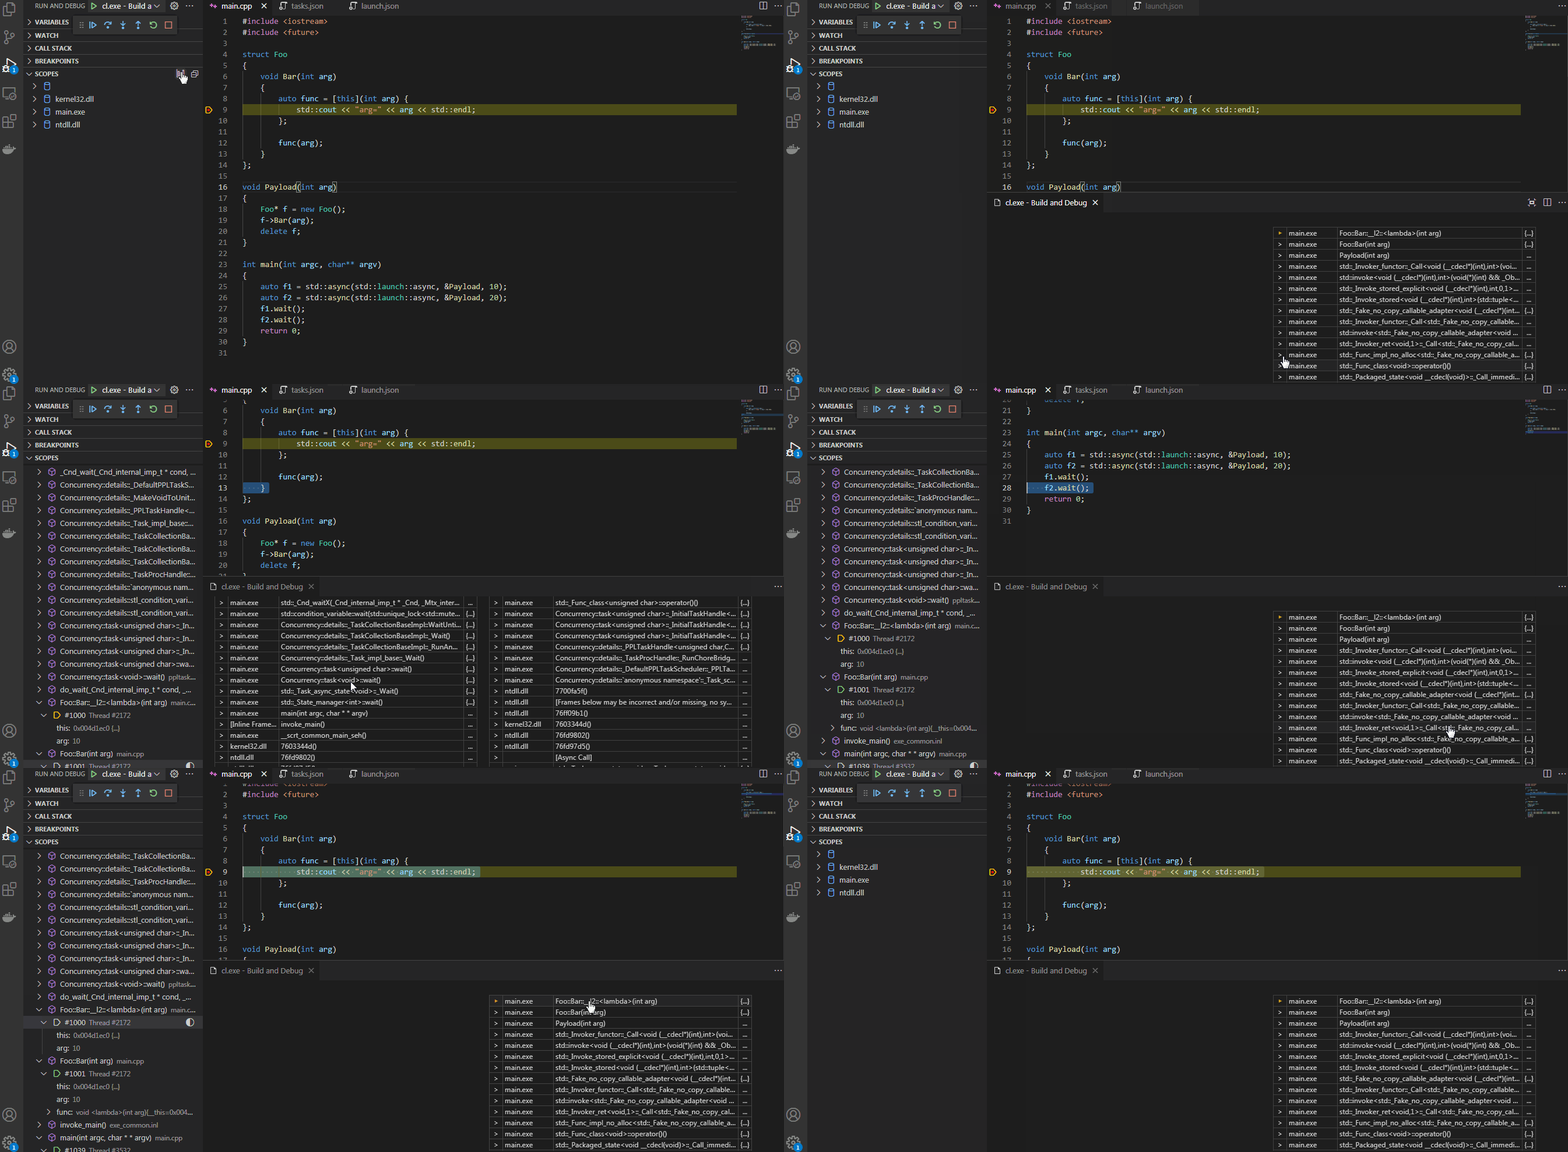
The stack-scopes is extension for Visual Studio Code. It provides additional Scopes view on the Debug side bar for cppdbg and cppvsdbg debug profiles and offers Stack Graph window for convenient analysis of application stacks.
- Build scopes tree view.
- Highlight shared scopes on the stack graph.
- Inspect any number of frame contexts.
- Reveal reference source code.
- Evaluate elements of dynamically allocated arrays.
- Search for references to variables.
- Work only with the selected stacks on the graph.
- Highlight matches of two dumps. NEW
The Scopes view represents stack frames grouped by locations of their scopes. This allows you to quickly find stack frames of interesting code, especially for snapshots with a large number of threads, check for mutual access to a specific context, find recursive calls, watch several frame scopes at the same time.
The main purpose of the Stack Graph window is to provide a possibility to analyze stacks for mutual use of modules, functions and even objects. For this you can apply color highlighting to elements you are interested in. Just press the ctrl key or the right mouse button and click the desired item on the stack graph. Also you can click appropriate icon on an item of the Scopes or References tree view. Click again to cancel the highlighting of the element.
You can unfold the context of any frame on the scope tree or right on the graph. Click on the frame badge to expand or collapse the context widget.
Both the Scopes view and the Stack Graph window support revealing reference code in the source files when clicking on frame items. To achieve this on the Stack Graph, you need to split the editor space and move the graph window to a secondary cell.
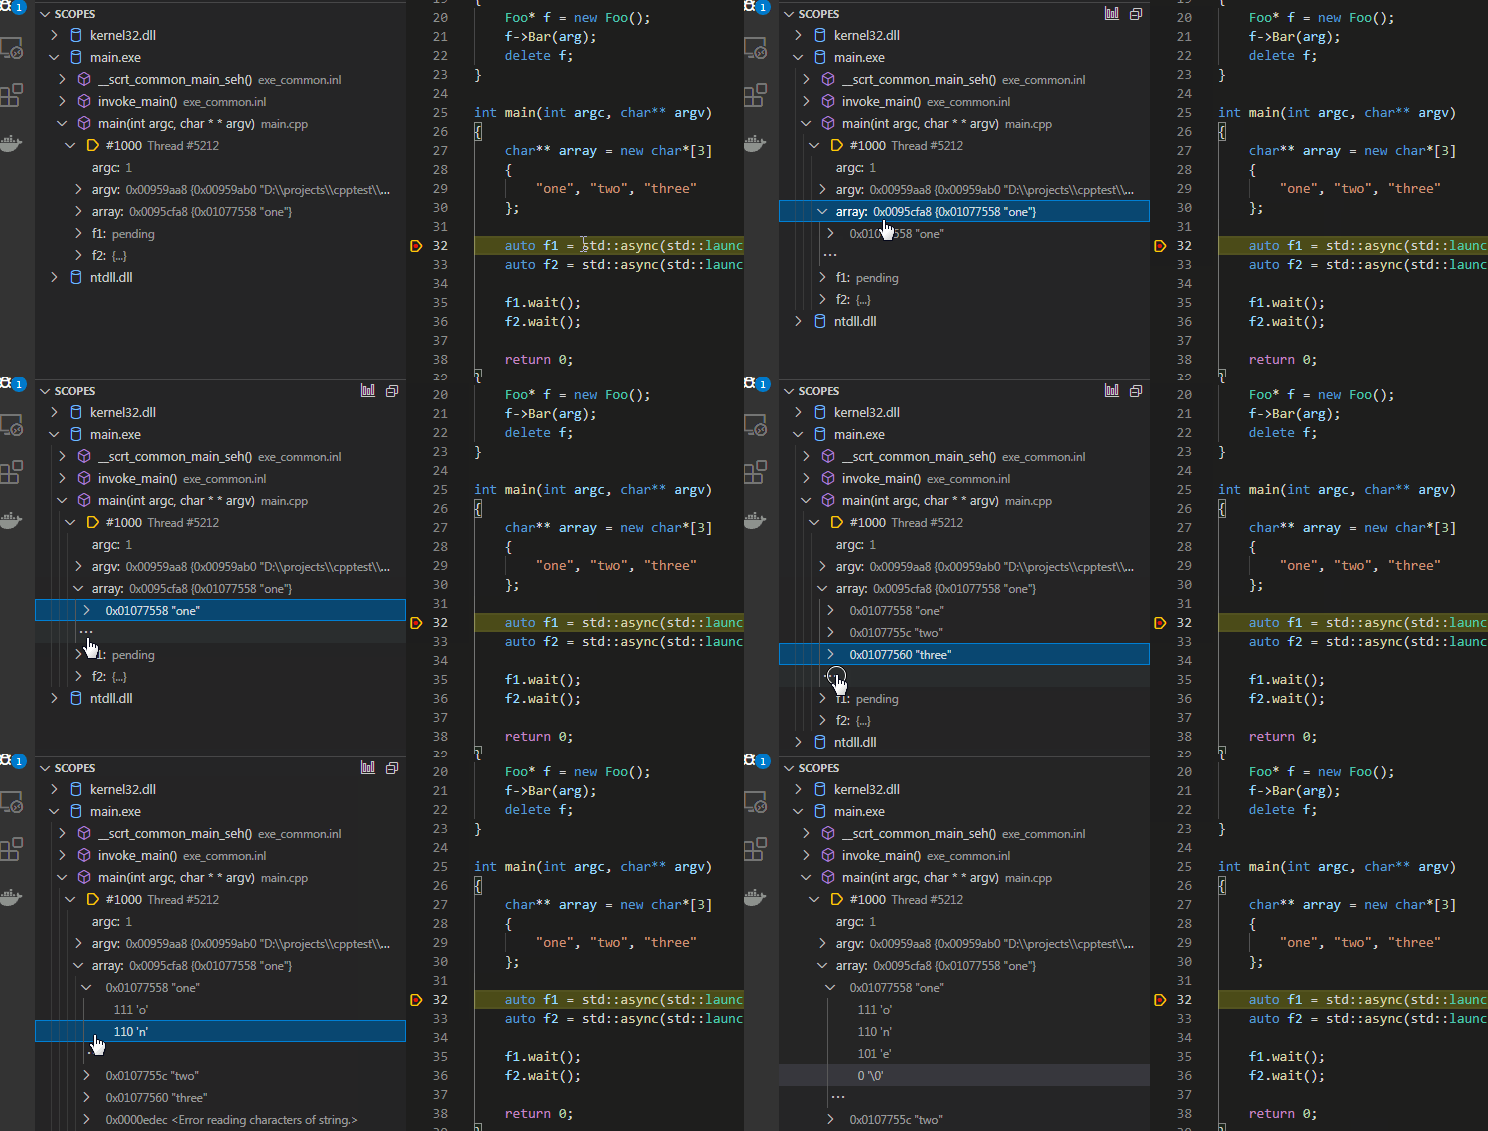
By default, you see only first element of the dynamically allocated arrays in the scope tree, because the debugger does not know the size of the array. You can evaluate following possible elements of the array variable under its tree item.
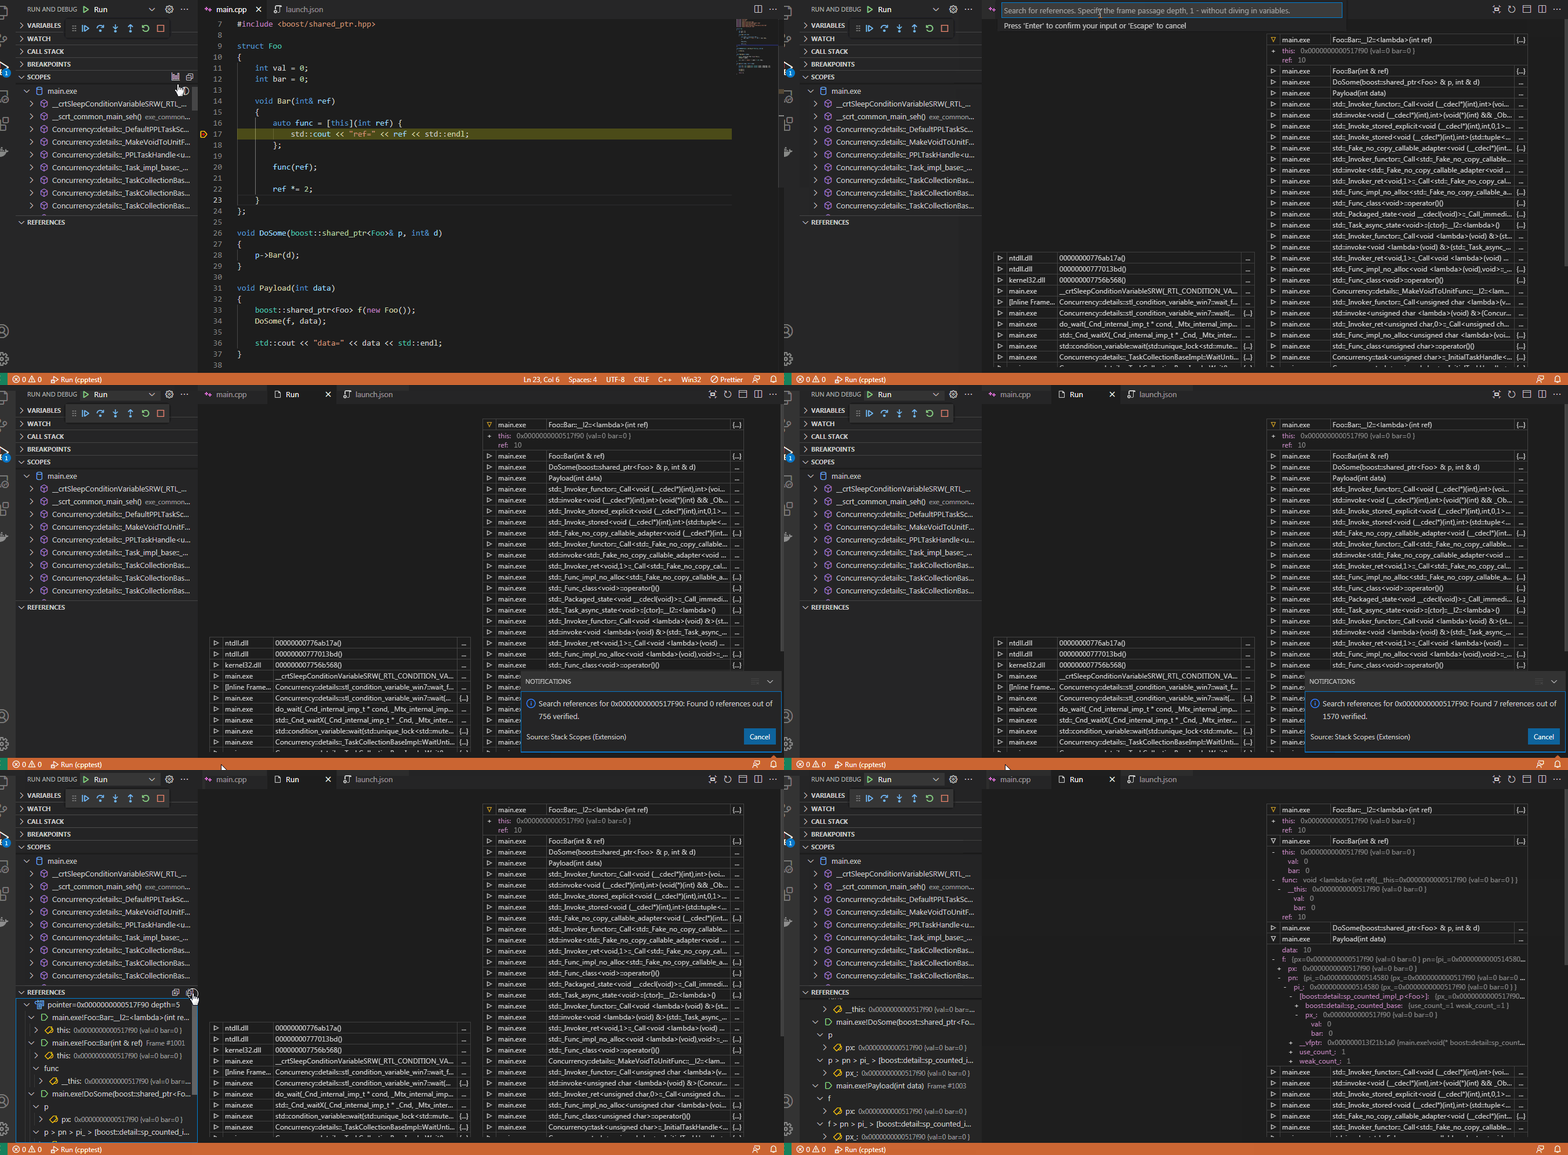
You can search for references to any variable in the frame scopes, as well as inside other variables accessible from stack frames. The search results depend on the quality of the debugging information and also on how the variables are represented by the debugging adapter. Also, the search is not performed in manually evaluated variables.
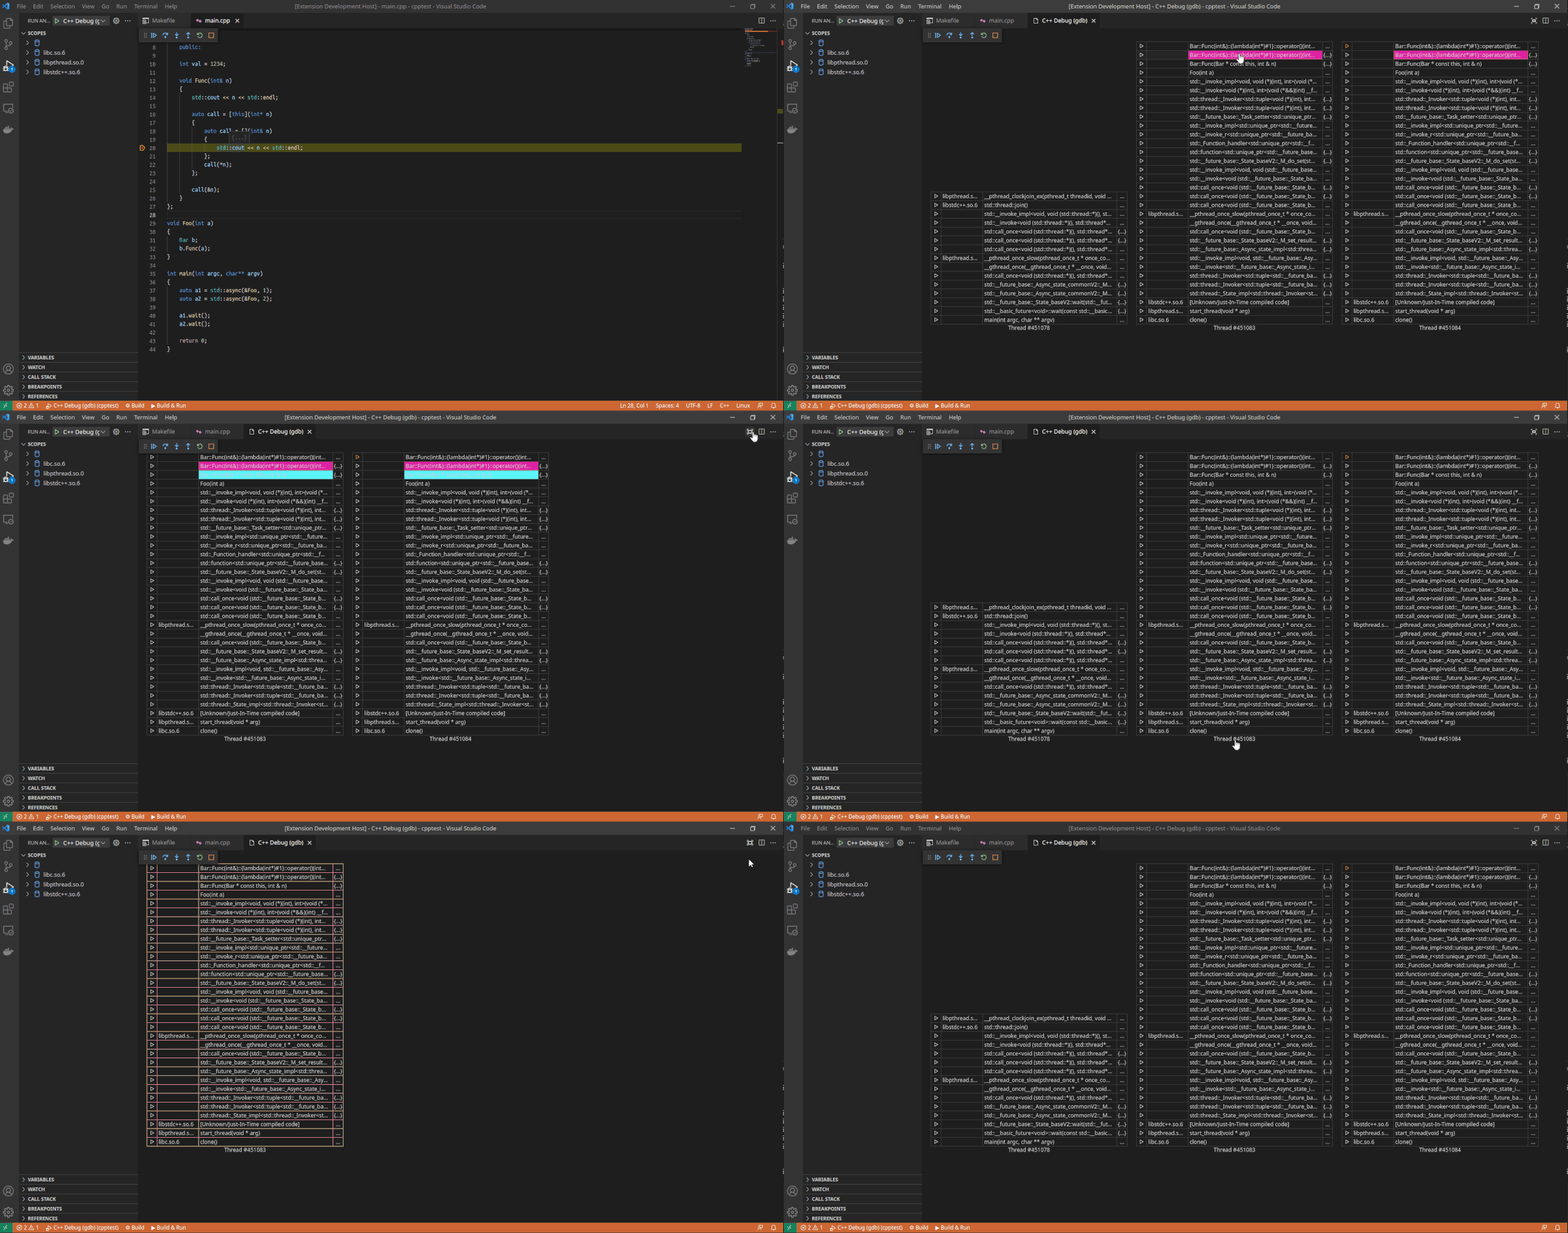
It is possible to reduce the number of stacks on the graph. Just highlight some stacks and change the drawing mode by switching the toggle in the top right corner of the graph window.
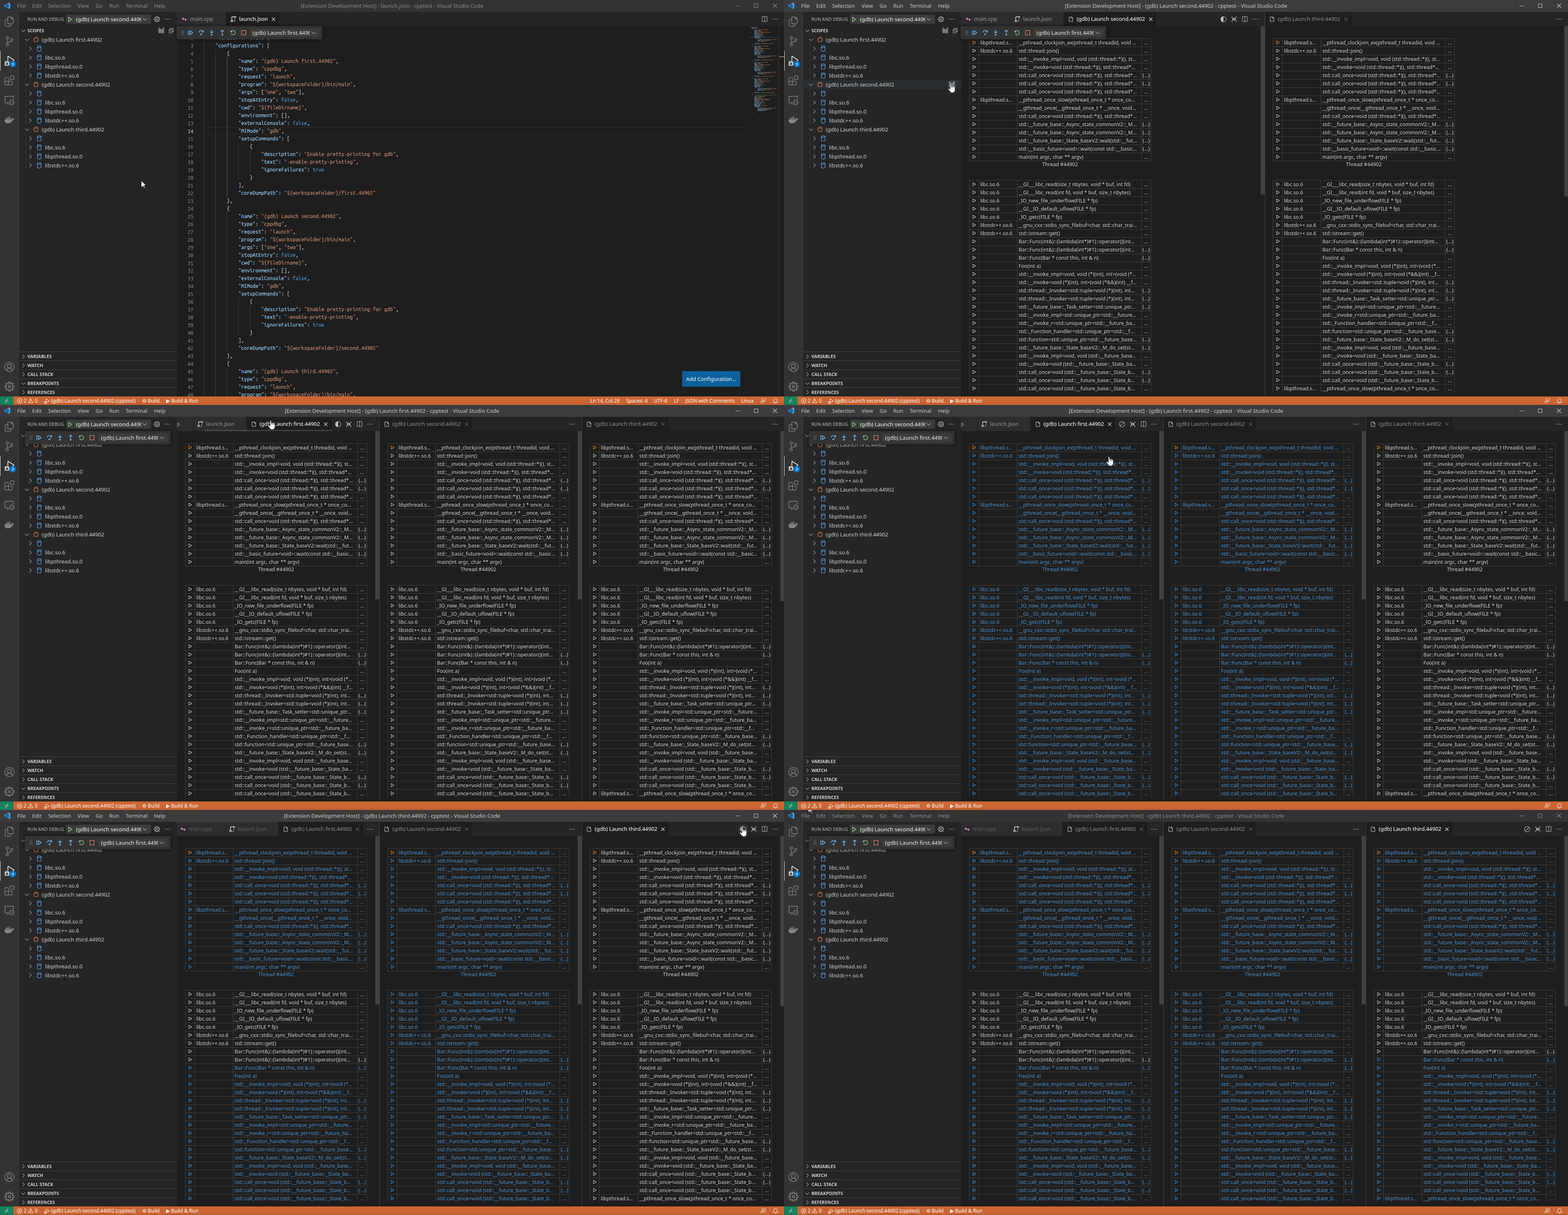
Now you can compare the stacks of two core dumps got from some process and highlight the matches on the Stack Graph. To do this, run debugging sessions for your core dumps, open graph window of some session, then select the session to compare using Colorize Matches button in the top right corner of the graph window.
Depends on ms-vscode.cpptools extension.
To install latest version of the extension from source, in addition to Visual Studio Code, Git and Node must be installed on your system.
- Clone
stack-scopesrepository.
git clone https://github.com/novemus/stack-scopes.git && cd stack-scopes- Install
vscepackage.
npm install -g vsce- Build
vsixpackage.
npm install && vsce package -o stack-scopes.vsix- Install
stack-scopesvsix package.
code --install-extension stack-scopes.vsixFeel free to report bugs and suggest new features and improvements.
MIT © Novemus Band
