A set of tools for graph layout and viewing
The simplest way to start with MSAGL in C# is to open GraphLayout.sln in Visual Studio 2013, and have a look at Samples there.
MSAGL is a .NET tool for graph layout and viewing. It was developed in Microsoft by Lev Nachmanson, Sergey Pupyrev, Tim Dwyer, Ted Hart, and Roman Prutkin.
The package contains the following:
- Layout engine (Microsoft.MSAGL.dll) - The core layout functionality. This component can be used directly in cases when visualization is handled by a tool other than MSAGL.
- Drawing module (Microsoft.MSAGL.Drawing.dll) - The Definitions of different drawing attributes like colors, line styles, etc. It also contains definitions of a node class, an edge class, and a graph class. By using these classes a user can create a graph object and use it later for layout, and rendering.
- Viewer control (Microsoft.MSAGL.GraphViewerGDIGraph.dll) - The viewer control, and some other rendering functionality.
Some important features of the viewer are:
- Pan and Zoom of the graph.
- Forward and Backward navigation.
- Ability to configure tooltips and highlighting of graph entities.
- Ability to search for and focus on entities of the graph.
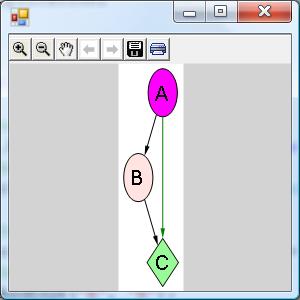
#Code Samples The code snippet demonstrates the basic usage of the viewer. It uses the C# language.
Drawing of the graph from the sampleDrawing of the graph from the sample
using System;
using System.Collections.Generic;
using System.Windows.Forms;
class ViewerSample {
    public static void Main() {
    //create a form
        System.Windows.Forms.Form form = new System.Windows.Forms.Form();
    //create a viewer object
        Microsoft.Msagl.GraphViewerGdi.GViewer viewer = new Microsoft.Msagl.GraphViewerGdi.GViewer();
    //create a graph object
        Microsoft.Msagl.Drawing.Graph graph = new Microsoft.Msagl.Drawing.Graph("graph");
    //create the graph content
        graph.AddEdge("A", "B");
        graph.AddEdge("B", "C");
        graph.AddEdge("A", "C").Attr.Color = Microsoft.Msagl.Drawing.Color.Green;
        graph.FindNode("A").Attr.FillColor = Microsoft.Msagl.Drawing.Color.Magenta;
        graph.FindNode("B").Attr.FillColor = Microsoft.Msagl.Drawing.Color.MistyRose;
        Microsoft.Msagl.Drawing.Node c = graph.FindNode("C");
        c.Attr.FillColor = Microsoft.Msagl.Drawing.Color.PaleGreen;
        c.Attr.Shape = Microsoft.Msagl.Drawing.Shape.Diamond;
    //bind the graph to the viewer
        viewer.Graph = graph;
    //associate the viewer with the form
        form.SuspendLayout();
        viewer.Dock = System.Windows.Forms.DockStyle.Fill;
        form.Controls.Add(viewer);
        form.ResumeLayout();
    //show the form
        form.ShowDialog();
    }
}
More code samples can be found here…
#GraphMaps This functionality allows viewing a large graph in the online map fashion. Here is a video demoing GraphMaps. To see the system in action please open Lg.sln, build it, and run TestGraphMaps. The configuration Release/x64 needs to be used to load a large graph. The graph from the video can be found in GraphLayout/graphs/composers.zip. Please load composers.msagl to avoid the preprocessing step. If composers.dot is loaded then composers.msagl and the tiles directory composers.msagl_tiles will be regenerated. GraphMaps ideas, design, and the mathematics are described in a paper.
This project has adopted the Microsoft Open Source Code of Conduct. For more information see the Code of Conduct FAQ or contact [email protected] with any additional questions or comments.


