A simple Java visualizer for functions with complex inputs and outputs that I wrote in 2016. This project has two main uses: showing a 6-second animation of a function acting on the complex plane, and mapping the complex plane to colors based on modulus (brightness) and argument (hue).
The provided code creates an animation of the function . The complex plane should warp into something like this:
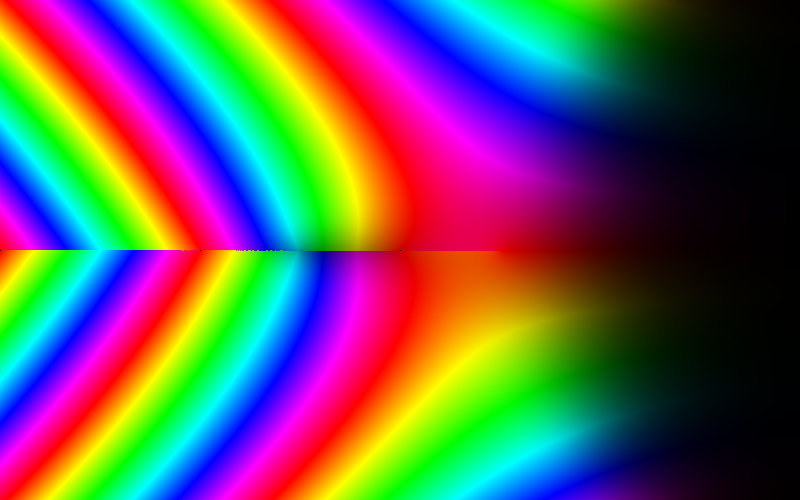
In the main class, there is also a commented-out example that maps the complex plane to colors. The brightness, between 0 and 1, is determined as a proportion of the given number's radius to a specified number (to make the colors clear, I take r=1 as the proportion). Below, the function is graphed using this technique on an 800 x 500 image:

As visible in the image above, numbers to the right -- that is, those with large real components -- have reciprocals with small real components, causing the inverse sine function to produce low-radius outputs.