


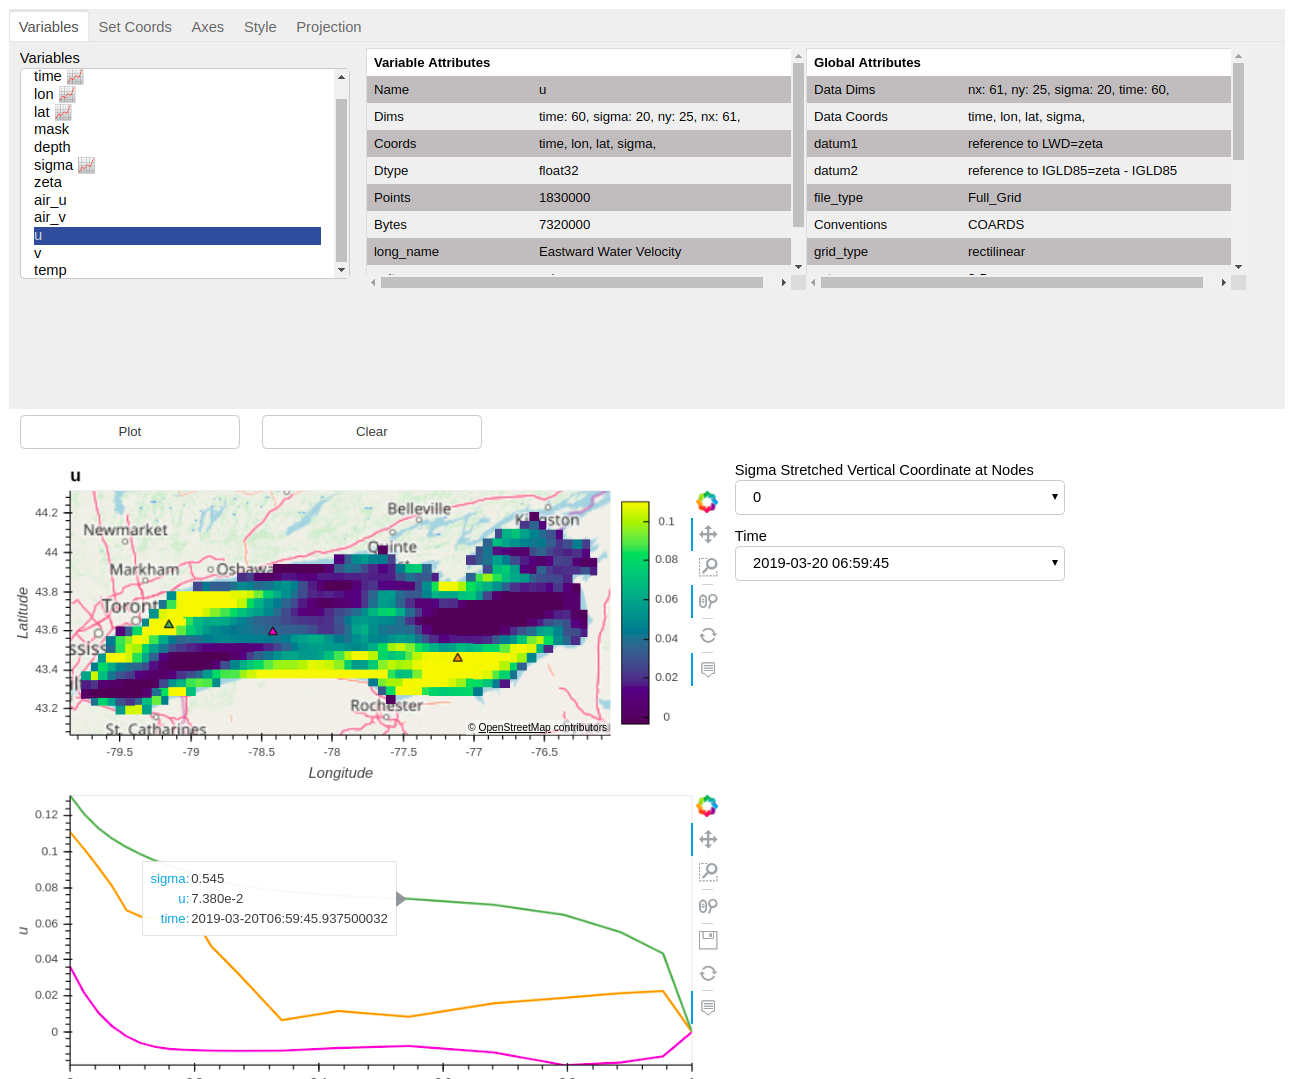
XrViz is an interactive graphical user interface(GUI) for visually browsing Xarrays. You can view data arrays along various dimensions, examine data values, change color maps, extract series, display geographic data on maps and much more.
It is built on Xarray, HvPlot and Panel. It can be used with Intake to ease the process of investigating and loading datasets.
This repository has extended intake/xrviz by including the option to have a volumetric rendering of the multi-dimensional datasets. The 3D interface has been developed as a prototype for the project Web based volume rendering and 3D/4D visualization of Model Forecast (NM389-ISRO) for Indian Space Research Organisation as a part of Smart India Hackathon 2020. The specific dataset used can be found here.
The 3D rendering part has been developed jointly by @hdsingh, @rumeetsingh, @SinghHrmn, @sbjaj33.

Documentation is available at Read the Docs.
Try it out on binder:
Recommended method using conda:
conda install -c conda-forge xrviz
You can also install using pip:
pip install xrviz
You can view the example dashboard by running following in command line (this will open a tab in your browser):
python -c "import xrviz; xrviz.example()"