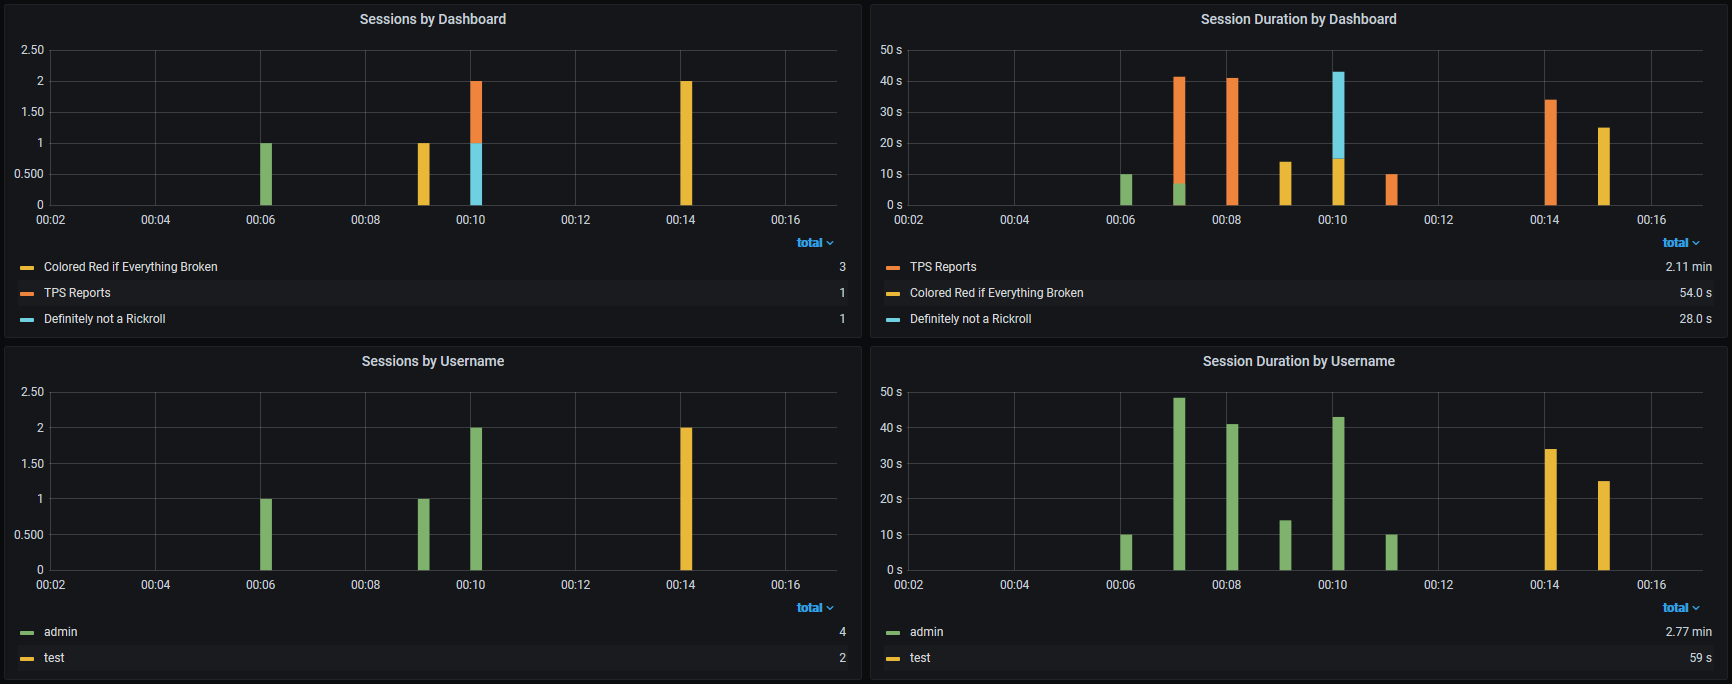
Grafana panel that lets you measure dashboard utilization. It's like Google Analytics, but for Grafana dashboards!
Have you ever found yourself wanting to know who is using your dashboards, or how much they are being used?
Have you ever asked yourself questions like, "Who should I be catering to" or "What data should I be focusing on"?
Analytics panel extends your dashboards by giving you full control of your user's session data, letting you gather details such as:
- Timestamps
- Session duration
- Tab focused state
- Selected variables
- Username
- User roles
- Dashboard Name/ID
- Instance info
You'll need to complete a few tasks to get up and running.
- Install the plugin
- Select, configure, and run a server
- Configure the panel
- Hide the panel (optional)
This plugin works by harvesting information about a user's session and the current environment, and forwarding that data as JSON to an endpoint of your choice.
To use this plugin, you must run a server to receive and store/emit data. There are a few different options to choose from, and they may each require different panel settings. Please refer to each of the linked servers' repos for more information.
This plugin's example directory has a few docker-compose files that should help you get started, however we do not have them for every server (contributions welcome).
Included in this plugin's repo is a simple Go server that requires no external dependencies. It can expose data to systems supporting the OpenMetrics standard (e.g. Prometheus, InfluxDB 2.0) and/or your logging system of choice via stdout (e.g. Loki).
Get started or test this option with docker-compose -f example/server/docker-compose.yaml up
@jtommi maintains analytics-panel-listener, a service that listens for this plugin's payloads and stores them in MongoDB.
You can use Telegraf's http_listener_v2 input to accept data from this plugin. An example configuration for this input can be found in the example directory. This example requires you to enable "flatten" in the plugin's settings. You can tweak this configuration to send data to any of Telegraf's many outputs.
Get started or test this option with docker-compose -f example/telegraf/docker-compose.yaml up
Most modern logging pipelines (e.g. Fluentd, Logstash) should support ingesting data from this plugin. You can either use the default server and ship logs from its output, or create an http listener to accept this plugin's JSON payloads. If you use either of these or some other system, please consider making a contribution by including your config in this plugin's examples directory.
You can design a your own service to accept payloads provided by the plugin, and transform / store data as you see fit. If you do this, please consider open sourcing your work and telling me about it in an issue, so that I can include a link to your work here.
Once you have a server running, you must place its endpoint in the plugin's settings. For example, if you use the default server, the endpoint would be http://your-server-name:your-port/write.
There are several other options which all provide descriptions in the Grafana UI. Please read them, and take note of any requirements in your server's documentation (for instance, using Telegraf is much more simple if you enable flatten, but most other servers will require flatten to be disabled).
This plugin works by using the session data provided to every panel in your dashboard. As such, you will need to ensure that analytics-panel is being loaded every time a dashboard you wish to monitor is being loaded. This means that you should place this panel in part of the dashboard that is guaranteed to be loaded by the user when they visit your dashboard. As of right now, the only place that you absolutely cannot place analytics-panel is inside a row, as expanding and collapsing the row is essentially the same as loading and unloading the entire dashboard, from any panel's perspective.
While you cannot place the panel inside a row, you can take several steps to make the panel very difficult to notice, and this will not have any negative effects on the plugin's behavior.
- In Visualization, set Hidden to True.
- In General Settings, set Transparent to True.
- In General Settings, set Title/Description to nothing. Alternatively, you can set a Title/Description and use this panel as a title, separator, or footer.
- Save and make the panel as small as you want. I found that 1 height, 100% width works well.
If you are planning on including this panel on many or all of your dashboards, you may want to consider changing the default settings for analytics-panel. This can save you time, since you will not need to input the same endpoint and/or toggle some setting every time you add a new panel.
You can edit defaults by doing the following:
- Edit the
src/defaults.jsonfile. - Run
npm run buildto generate an updated dist. - Sign with a private signature (optional).
- Copy the updated plugin to your plugins directory.
- Restart Grafana.
Note that changing defaults will not change existing panels. Defaults are copied to the dashboard when the panel is added.
If something is not working properly, the first thing you should do is look at your browser's console and network inspector. After opening the inspector, load a dashboard with an analytics-panel and take a look at the console, the request, and the response. In most cases, problems should be evident here.
In the event that you have many panels scattered across many dashboards, and suspect that some panels may be experiencing issues, you can sort your dashboards by "Errors Total - Most", or one of its variants. Note that errors are not thrown if JSON data is visible.
If you run into an issue you cannot solve, please post an issue and I will do my best to look into your inquiry.


