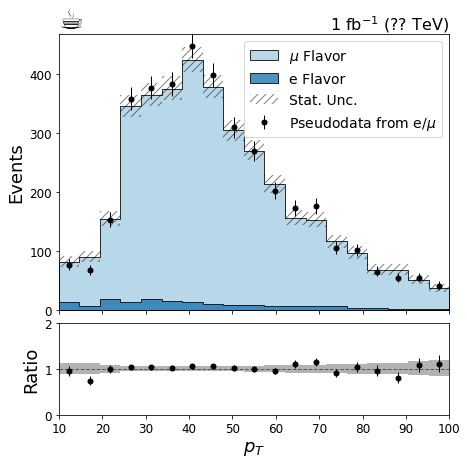
Uncertainties for data/prediction ratio plots #196
Replies: 1 comment
-
|
As was brought up in a separate conversation for my own clarity with @alexander-held, @lukasheinrich, and @kratsg, the uncertainties shown for the relative model uncertainty (the ratio of the model predictions with full uncertainties to the model predictions themselves) should be added, and I missed these previously when adding the uncertainties between the ratio of the data and the model. (I guess more generally this would be the relative uncertainties on the denominator histogram and then the uncertainties of the ratio between the numerator and denominator histograms). This is already done in # add uncertainty band around y=1
rel_mc_unc = total_model_unc / total_yield
ax2.bar(
bin_centers,
2 * rel_mc_unc,
width=bin_width,
bottom=1 - rel_mc_unc,
fill=False,
linewidth=0,
edgecolor="gray",
hatch=3 * "/",
)as well as in if denom_fill_opts is not None:
unity = numpy.ones_like(sumw_denom)
denom_unc = poisson_interval(unity, sumw2_denom / sumw_denom ** 2)
opts = {"step": "post", "facecolor": (0, 0, 0, 0.3), "linewidth": 0}
opts.update(denom_fill_opts)
ax.fill_between(
edges,
numpy.r_[denom_unc[0], denom_unc[0, -1]],
numpy.r_[denom_unc[1], denom_unc[1, -1]],
**opts
)Examples:
I'll also tag @nsmith- to see if there's any thoughts on details of implementation to think about adding that I'm missing. |
Beta Was this translation helpful? Give feedback.


-
The
.plot_ratioAPI introduces a way to plot ratios of histograms, including uncertainties for this ratio. It is common to show uncertainties for (a stack of histograms or a single histogram with) model predictions and data statistical uncertainties separately in ratio plots. A random example is this plot.Is it possible to create a plot like this with
hist? Possibly related: #192, and #117 in case something like this fits better intomplhep.cc @matthewfeickert
Beta Was this translation helpful? Give feedback.
All reactions