corrected_effect_se is unusually large #5
Comments
|
@n-mounier HI, could you please response the above issue, I |
|
Hello, |
Sign up for free
to join this conversation on GitHub.
Already have an account?
Sign in to comment
Hi,
I`m new in this field and not good at the mathematics.
Recently I`m doing two sample MR analysis between metabolome sumstats by using MRlap. I found most of my results have extremely large corrected_effect_se value (corrected_effect_p is nearly 1) while the observed_effect_se seems usual (observed_effect_p is very low and significant) and p_difference is nearly 1 (as below). May I ask how to interpret the results and which value (corrected or observed) should I use in this case.
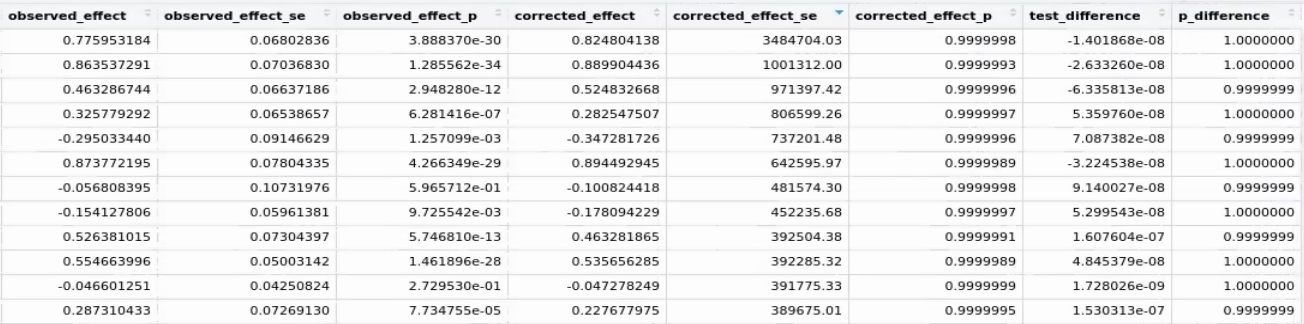
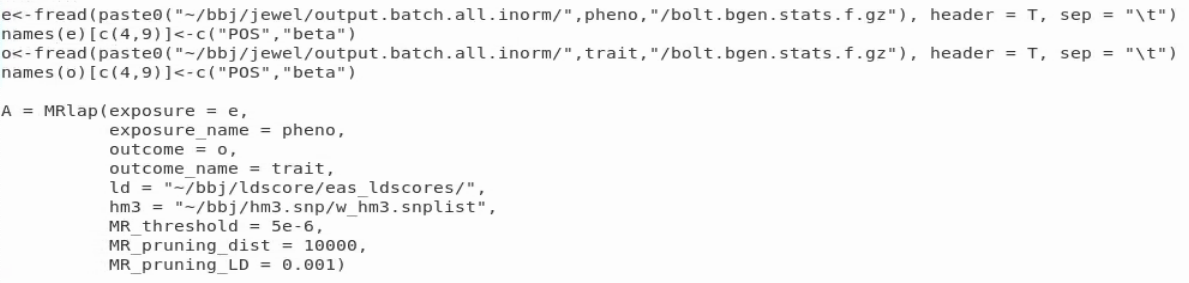
For the GWAS sumstats, both of them are analyzed by about 10000 samples, and sample overlap rate is 100%, number of IVs is 14 to 22. I also attached my R code below. This is a common issue and I also found the similar case by using other sumstats (n=100,000, sample overlap rate 10%).
The text was updated successfully, but these errors were encountered: