Name
RWI波动率反转策略RWI-Volatility-Contrarian-Strategy
Author
ChaoZhang
Strategy Description
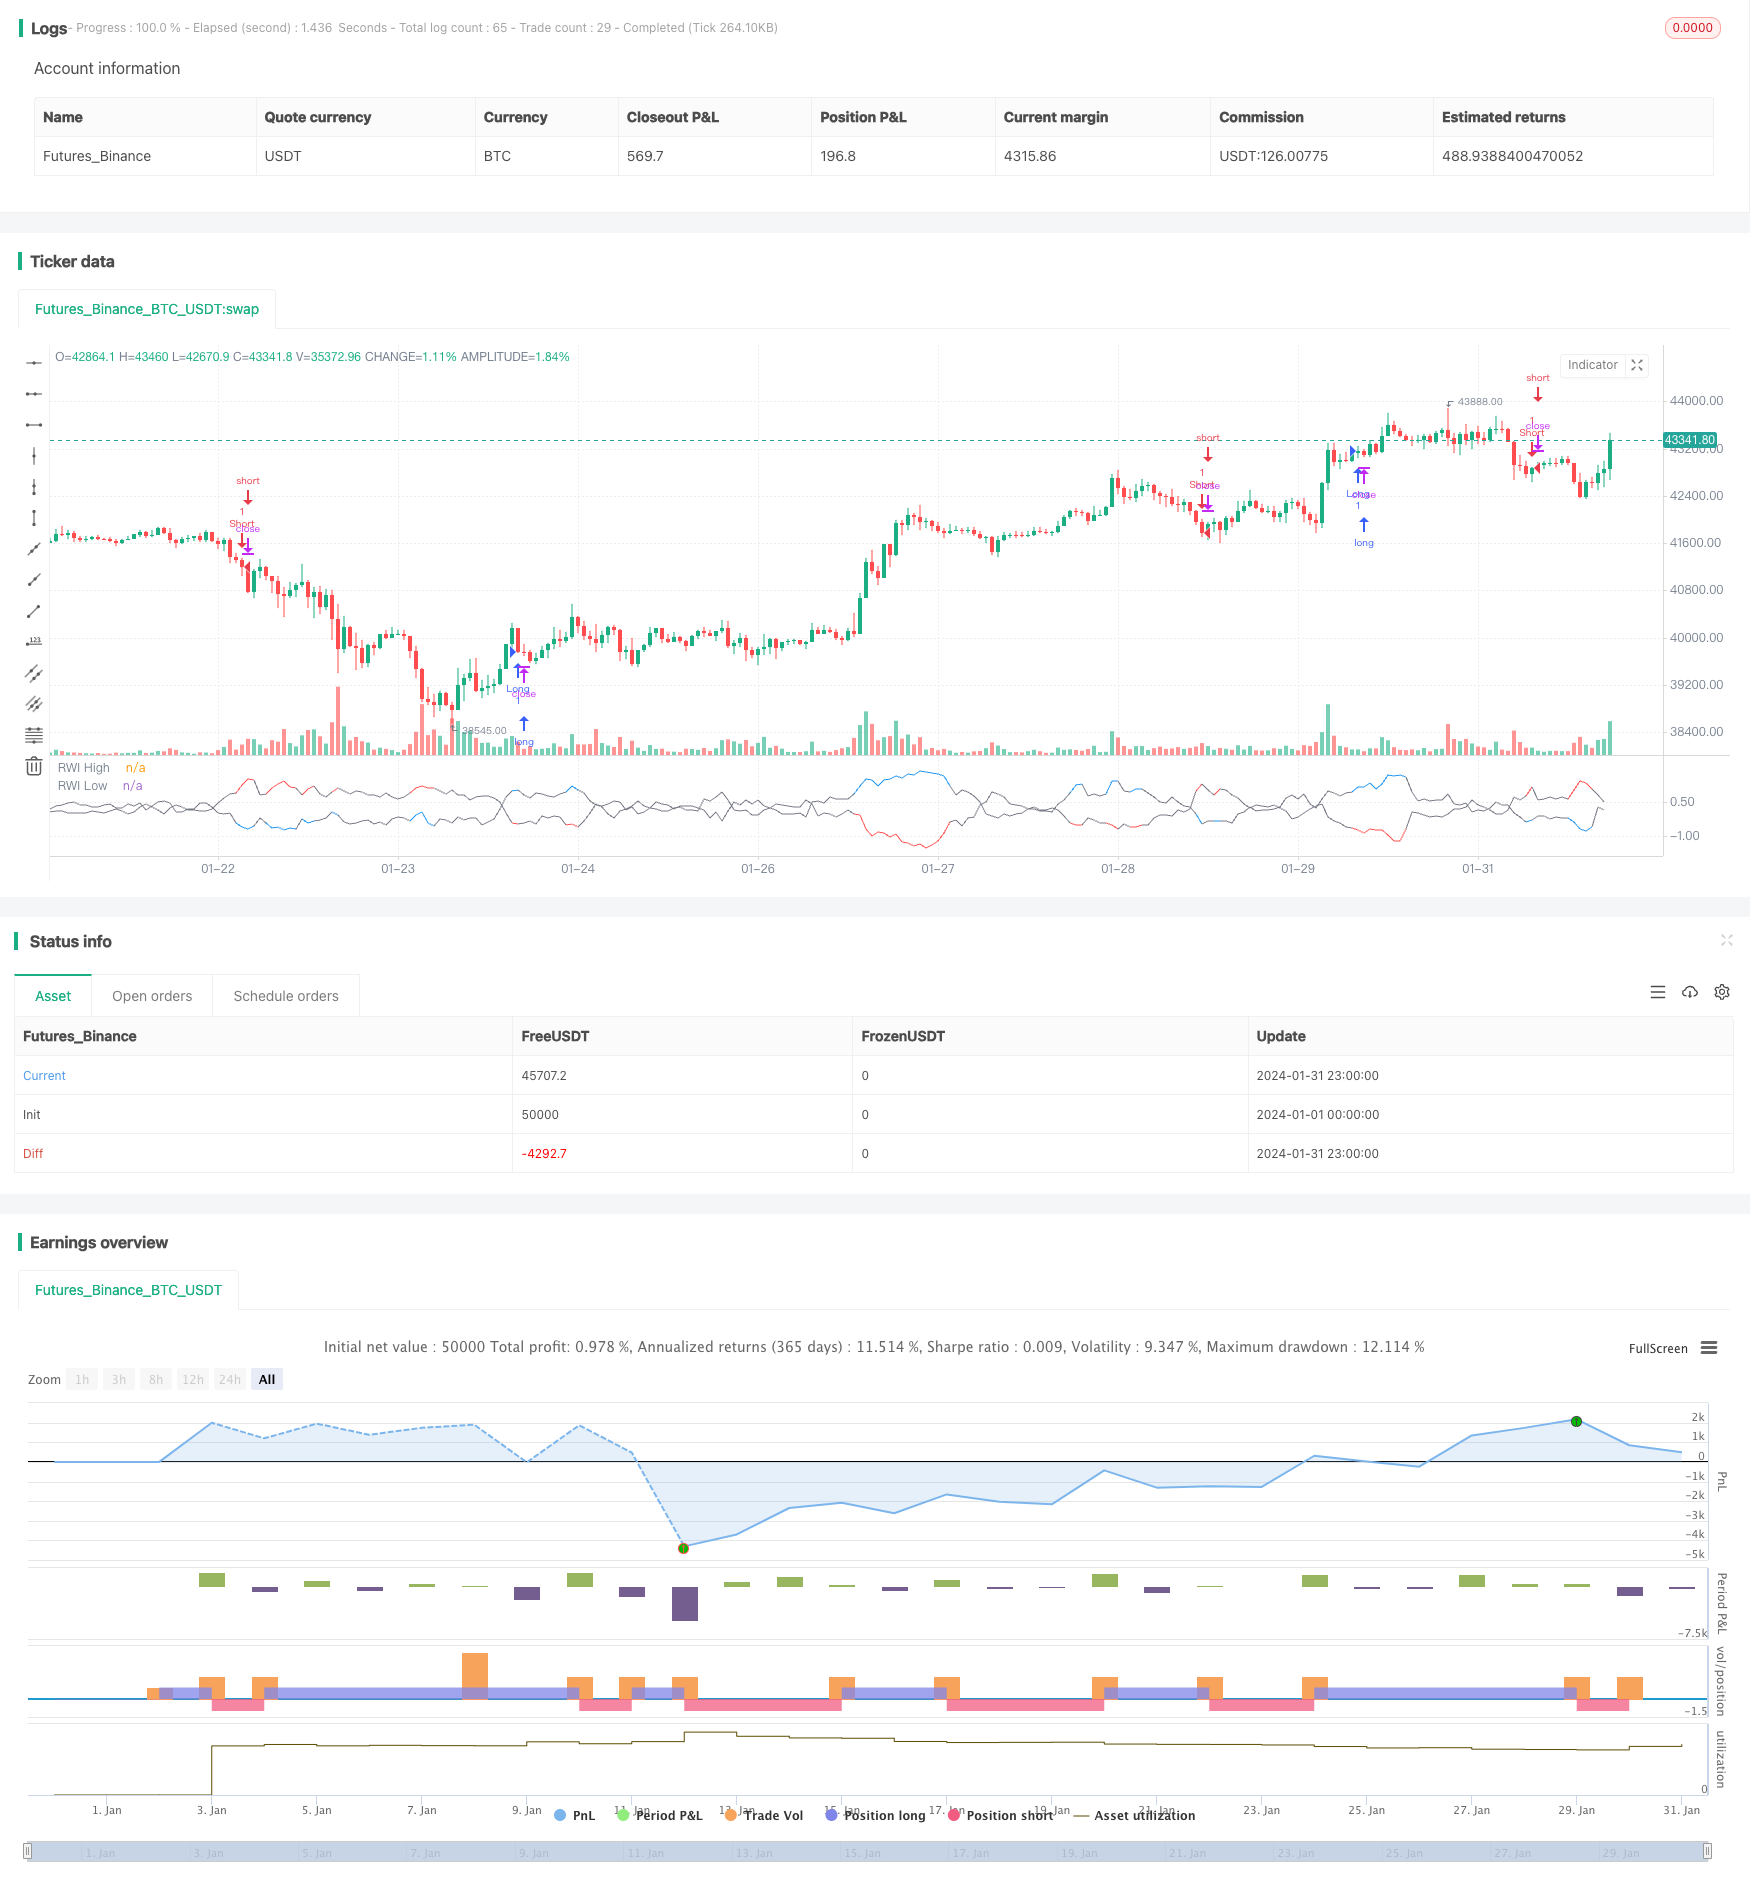
RWI波动率反转策略通过计算一定周期内的RWI高点和RWI低点,判断市场是否处于反转状态,以发现反转机会,采用反转策略,在高位开空头,低位开多头,以期获利。
该策略首先计算一定长度周期(如14根K线)内的RWI高点和RWI低点。RWI高低点的计算公式如下:
RWI高点=(高点-N周期前的最低点)/(N周期的ATR* sqrt(N))
RWI低点=(N周期前的最高点-最低点)/(N周期的ATR* sqrt(N))
然后计算RWI高低点与阈值的差值,判断是否小于阈值(如1)。如果 RWI高低点都小于阈值,则判断市场处于震荡状态,这时不做任何操作。
如果RWI高点大于RWI低点超过阈值,则判断行情即将反转,此时可以考虑做空;如果RWI低点大于RWI高点超过阈值,则判断行情即将反转,此时可以考虑做多。这样,就构成了一个基于RWI指标判断市场反转状态的反转交易策略。
RWI波动率反转策略具有以下优势:
- 使用RWI指标判断反转点精确,胜率较高
- 采用反转策略,适合市场震荡行情
- 策略思路清晰易懂,参数调整灵活
- 可配置长短两个周期判断,提高信号质量
RWI波动率反转策略也存在以下风险:
- 反转信号可能出现假突破,从而产生损失
- 行情持续趋势时,反转信号更多,会招致损失
- RWI参数设置不当可能导致信号质量下降
- 波动率扩大时,RWI指标失效
为控制风险,可以适当调整RWI参数,配置过滤条件,限定反转范围等。
RWI波动率反转策略还可以从以下几个方面进行优化:
- 增加双时间轴判断,配置长短周期RWI指标,提高信号质量
- 结合其他指标如KD、MACD等判断反转,避免假突破
- 配置止损策略,严格控制单笔损失
- 动态优化RWI参数,适应市场变化
- 优化仓位管理,根据市场状况加减仓
RWI波动率反转策略整体思路清晰,使用RWI指标判断反转时机,策略交易逻辑较好,在震荡盘整市场中效果较佳。通过参数优化、风险控制等手段,可以将该策略运用得更加稳定高效。
||
The RWI volatility contrarian strategy calculates the RWI highs and lows over a certain period to determine whether the market is in a reversal state in order to discover reversal opportunities. It adopts a contrarian strategy, going short at the highs and long at the lows, aiming for profit.
The strategy first calculates the RWI highs and lows over a certain length period (such as 14 candles). The calculation formulas are as follows:
RWI High = (High - Lowest of N Periods Ago) / (ATR of N Periods * sqrt(N))
RWI Low = (Highest of N Periods Ago - Low) / (ATR of N Periods * sqrt(N))
Then calculate the difference between the RWI highs/lows and the threshold to determine if it is below the threshold (such as 1). If both RWI highs and lows are below the threshold, the market is determined to be ranging. In this case, no action is taken.
If the RWI high is above the RWI low by more than the threshold, it is determined that the price is about to reverse, and one may consider going short. If the RWI low is above the RWI high by more than the threshold, it is determined that the price is about to reverse, and one may consider going long. This forms a contrarian trading strategy based on RWI to determine market reversal states.
The RWI volatility contrarian strategy has the following advantages:
- Using the RWI indicator to determine reversal points is accurate with high winning rate
- Adopting contrarian strategies is suitable for ranging markets
- The strategy logic is clear and easy to understand, parameters are flexible
- Long and short cycles can be configured to improve signal quality
The RWI volatility contrarian strategy also has the following risks:
- Reversal signals may have false breakouts, resulting in losses
- More reversal signals occur during sustained trends, leading to losses
- Improper RWI parameter settings may reduce signal quality
- RWI indicator fails when volatility increases
To control risks, RWI parameters can be adjusted accordingly, filters can be added, reversal ranges can be limited, etc.
The strategy can be further optimized in the following ways:
- Add double time frame analysis using long and short RWI periods to improve signals
- Combine with other indicators like KD and MACD to avoid false breakouts
- Configure stop loss strategies to strictly control single loss
- Dynamically optimize RWI parameters to adapt to market changes
- Optimize position management, add or reduce positions based on market conditions
The RWI volatility contrarian strategy has clear logic using RWI to determine reversals. The trading logic is solid and works well in ranging markets. By optimizing parameters, controlling risks etc, the strategy can be applied more steadily and efficiently.
[/trans]
Strategy Arguments
| Argument | Default | Description |
|---|---|---|
| v_input_1 | 14 | Length |
| v_input_2 | true | Threshold |
Source (PineScript)
/*backtest
start: 2024-01-01 00:00:00
end: 2024-01-31 23:59:59
period: 1h
basePeriod: 15m
exchanges: [{"eid":"Futures_Binance","currency":"BTC_USDT"}]
*/

//@version=4
// Copyright (c) 2020-present, JMOZ (1337.ltd)
strategy("RWI Strategy", overlay=false)


length = input(title="Length", type=input.integer, defval=14, minval=1)
threshold = input(title="Threshold", type=input.float, defval=1.0, step=0.1)


rwi(length, threshold) =>
    rwi_high = (high - nz(low[length])) / (atr(length) * sqrt(length))
    rwi_low = (nz(high[length]) - low) / (atr(length) * sqrt(length))
    is_rw = rwi_high < threshold and rwi_low < threshold
    [is_rw, rwi_high, rwi_low]


[is_rw, rwi_high, rwi_low] = rwi(length, threshold)


long = not is_rw and rwi_high > rwi_low
short = not is_rw and rwi_low > rwi_high


strategy.entry("Long", strategy.long, when=long)
strategy.entry("Short", strategy.short, when=short)


plot(rwi_high, title="RWI High", linewidth=1, color=is_rw?color.gray:color.blue, transp=0)
plot(rwi_low, title="RWI Low", linewidth=1, color=is_rw?color.gray:color.red, transp=0)
Detail
https://www.fmz.com/strategy/440724
Last Modified
2024-02-01 14:56:58
