Name
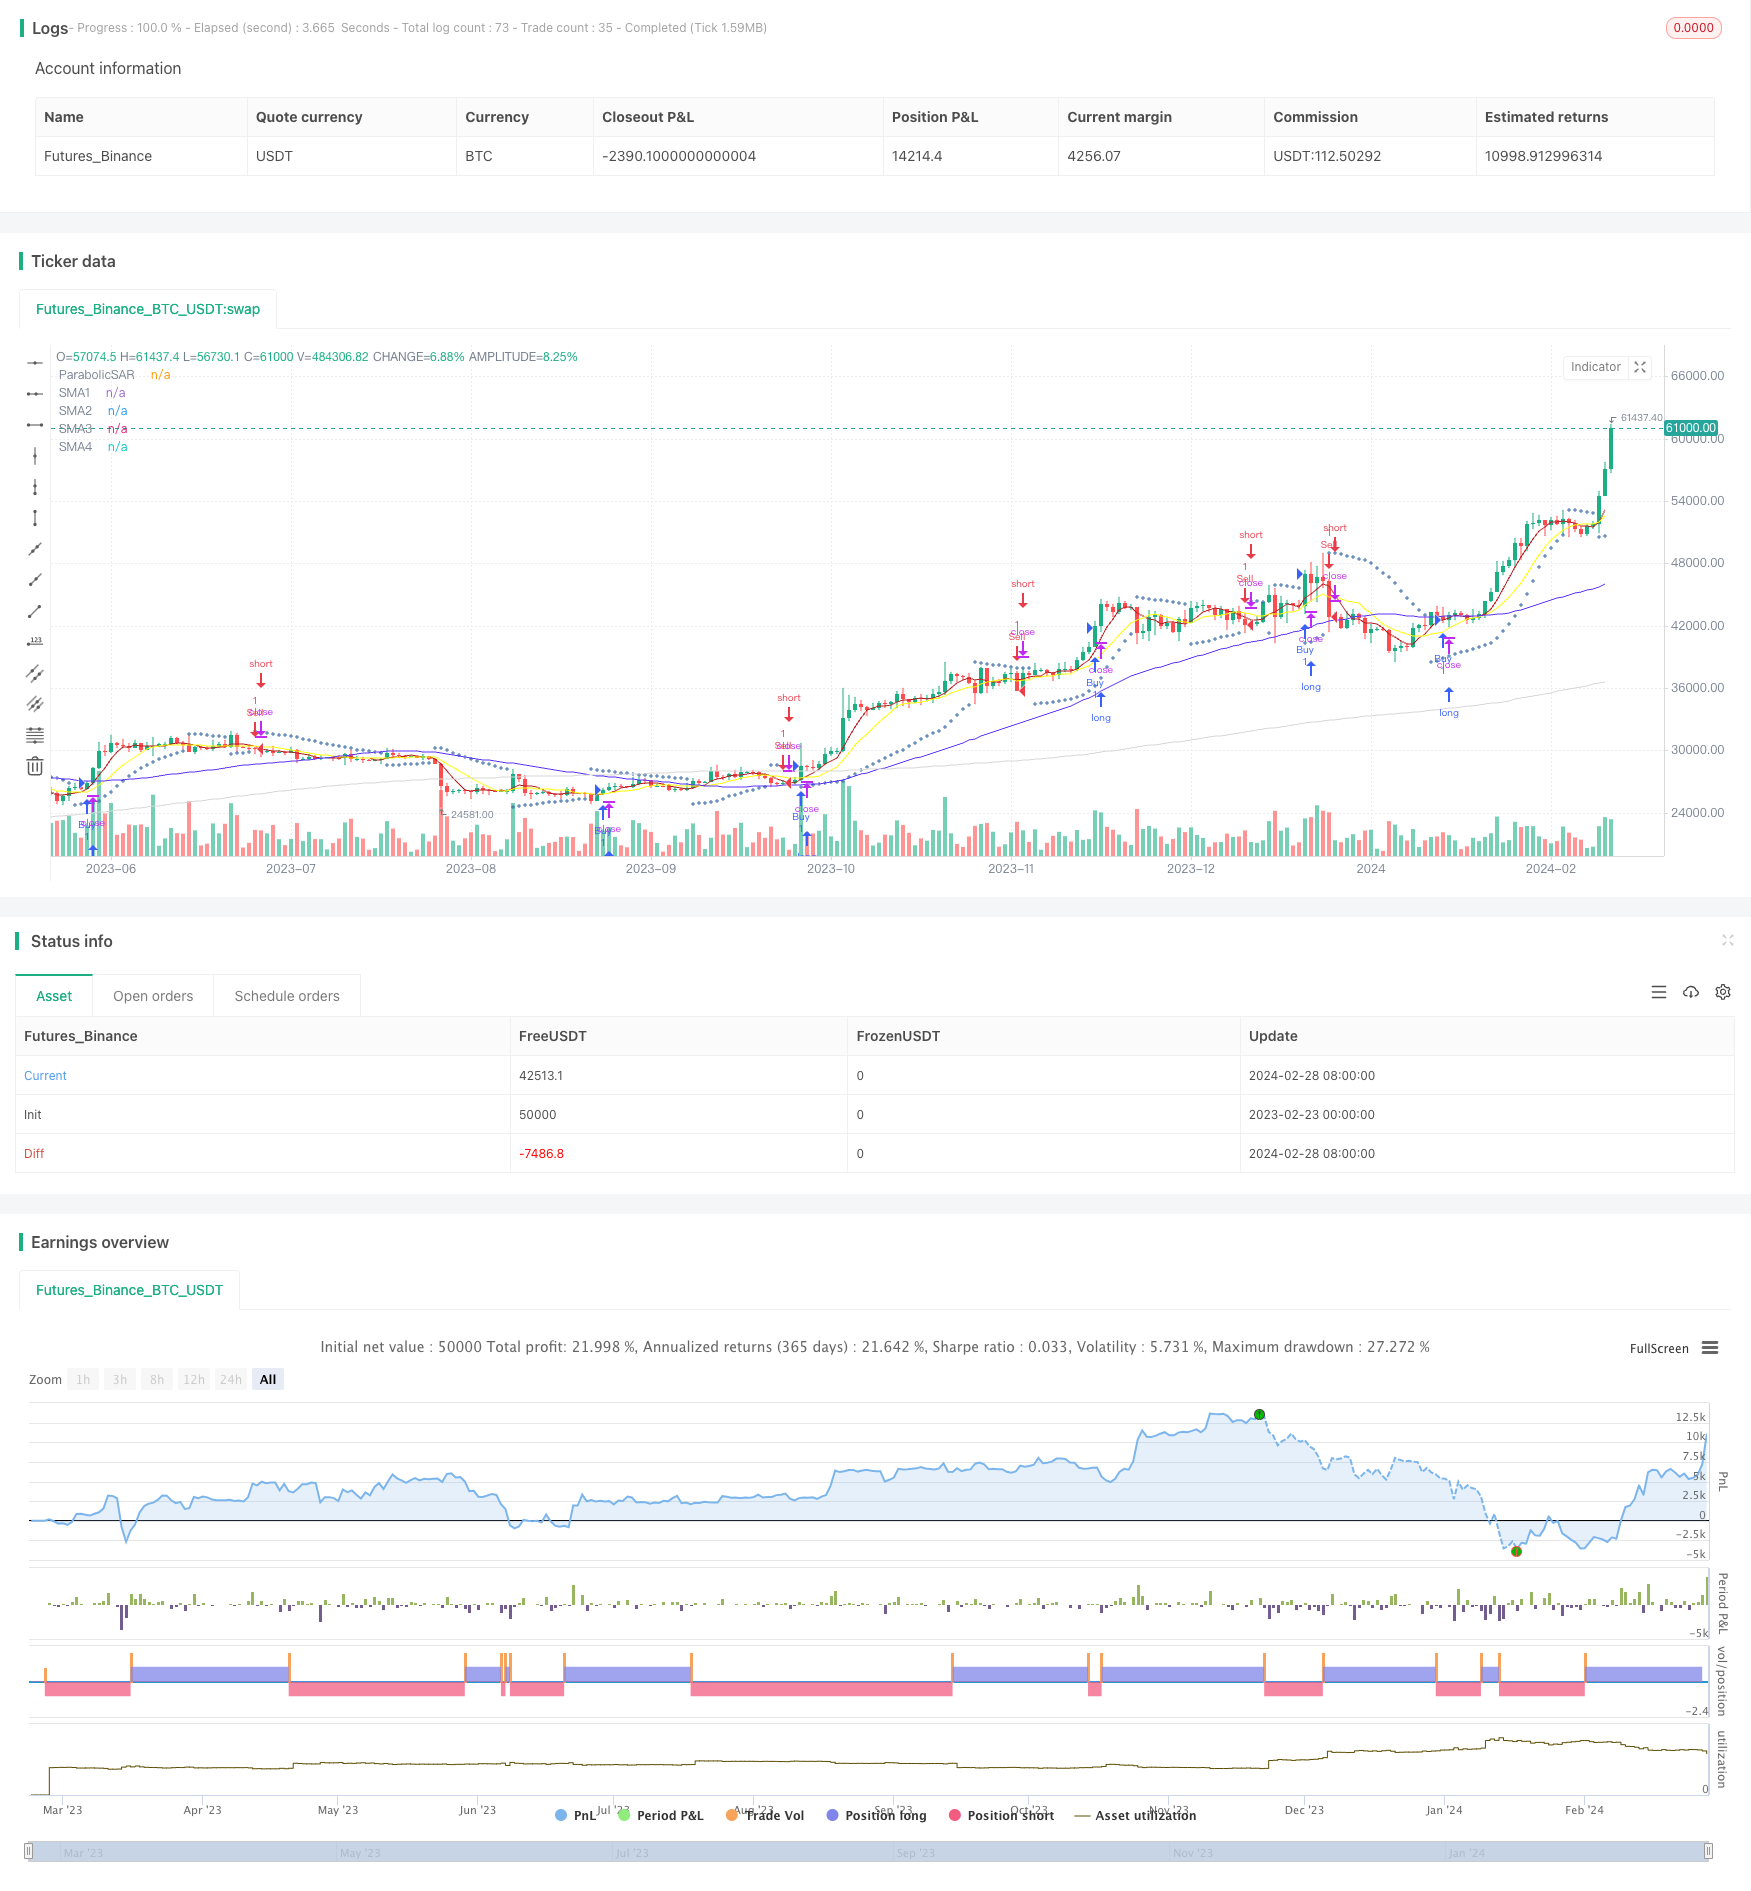
MACDRSI与EMA策略MACD-RSI-and-EMA-Strategy
Author
ChaoZhang
Strategy Description
该策略结合了移动平均线(SMA)、平均真实范围指标(ATR)、顺势指标(CCI)和布林带,旨在发现短期和中期价格趋势,为交易决策提供支持。
该策略使用四条不同周期的SMA曲线来识别价格趋势方向,包括5日、10日、50日和200日线。ATR用于测量市场波动率和设置止损点。CCI用于识别超买超卖情况。而布林带上下轨则可作为支持阻力位。
当短期SMA(5日和10日线)上穿长期SMA(50日和200日线)时,做多。当短期SMA下穿长期SMA时,做空。CCI大于100时卖出,小于-100时买入。止损点按照ATR值设置。
该策略结合移动平均线的趋势判断和CCI的超买超卖判断,可以有效把握市场机会。特别是中短期交易效果更佳。另外,风险控制比较科学,可以最大程度避免亏损。
该策略较为保守,容易产生错过信号的情况。当出现震荡市或趋势反转时,止盈可能会较早被触发。此外,参数设置不当也会对效果产生影响。
可尝试优化SMA的参数,使之更贴近当前市场状态。也可以调整布林带的标准差,使之更适合作为支持阻力位。此外,可以考虑加入其他指标辅助判断,如KDJ、MACD等。这可能会提高策略的胜率。
该策略整合了多种分析工具判断市场,在parameter设置得当的情况下,可以获得不错的投资回报。其止损规则也使得风险可控。值得实盘验证与优化。
||
This strategy combines Simple Moving Average (SMA), Average True Range (ATR), Commodity Channel Index (CCI) and Bollinger Bands to identify short-term and mid-term price trends and provide support for trading decisions.
The strategy uses four SMA lines with different periods to recognize price trend direction, including 5-day, 10-day, 50-day and 200-day lines. ATR is used to measure market volatility and set stop-loss points. CCI is used to identify overbought and oversold conditions. The upper and lower rails of Bollinger Bands can serve as support/resistance levels.
Go long when the short-term SMA (5-day and 10-day lines) crosses above the long-term SMA (50-day and 200-day lines). Go short when the short-term SMA crosses below the long-term SMA. Sell when CCI is greater than 100; Buy when CCI is less than -100. Set stop loss based on ATR values.
By combining the trend judgment of moving average lines and the overbought/oversold judgment of CCI, this strategy can effectively seize market opportunities. It works especially well for medium and short-term trading. In addition, the risk control is relatively scientific, which can maximize the avoidance of losses.
This strategy is relatively conservative and likely to miss trading signals. When there is range-bound market or trend reversal, profit-taking may be triggered prematurely. In addition, improper parameter settings can also affect performance.
Try to optimize the parameters of SMA to make them closer to current market conditions. The standard deviation of Bollinger Bands can also be adjusted for better performance as support/resistance levels. In addition, consider adding other indicators to assist judgment, such as KDJ, MACD etc. This may improve win rate of the strategy.
Integrating a variety of analytical tools to judge the market, this strategy can yield satisfactory investment returns when parameters are set appropriately. Its stop loss rules also make risks controllable. It is worthwhile to verify and optimize in paper trading and live trading.
[/trans]
Strategy Arguments
| Argument | Default | Description |
|---|---|---|
| v_input_1 | 5 | EMA1 length |
| v_input_2 | 20 | EMA2 length |
| v_input_3 | 12 | MACD Fast |
| v_input_4 | 26 | MACD Slow |
| v_input_5 | 20 | MACD Signal length |
| v_input_6 | 5 | SMA1 Length |
| v_input_7 | 10 | SMA2 Length |
| v_input_8 | 50 | SMA3 Length |
| v_input_9 | 200 | SMA4 Length |
| v_input_10 | true | Line width |
| v_input_11_close | 0 | Source: close |
| v_input_12 | 14 | RSI length |
| v_input_13 | 20 | RSI signal length |
| v_input_14 | 0.02 | PSAR_start |
| v_input_15 | 0.02 | PSAR_increment |
| v_input_16 | 0.2 | PSAR_maximum |
Source (PineScript)
/*backtest
start: 2023-02-23 00:00:00
end: 2024-02-29 00:00:00
period: 1d
basePeriod: 1h
exchanges: [{"eid":"Futures_Binance","currency":"BTC_USDT"}]
*/

// This source code is subject to the terms of the Mozilla Public License 2.0 at https://mozilla.org/MPL/2.0/
// © maizirul959

//@version=4
strategy("MACD,RSI & EMA strategy with MA+PSAR by MAM", overlay=true)

//Input Data
_ema_len1 = input(5, title="EMA1 length")
_ema_len2 = input(20, title="EMA2 length")

_macd_fast = input(12, title="MACD Fast")
_macd_slow = input(26, title="MACD Slow")
_macd_signal_len = input(20, title="MACD Signal length")

//MAM add SMA
_sma_len1 = input(5, title="SMA1 Length")
_sma_len2 = input(10, title="SMA2 Length")
_sma_len3 = input(50, title="SMA3 Length")
_sma_len4 = input(200, title="SMA4 Length")

lineWidth = input(1, minval=1, title="Line width")

src = input(close, title="Source")

SMA1 = if _sma_len1 != 0
    sma(src, _sma_len1)
SMA2 = if _sma_len2 != 0
    sma(src, _sma_len2)
SMA3 = if _sma_len3 != 0
    sma(src, _sma_len3)
SMA4 = if _sma_len4 != 0
    sma(src, _sma_len4)


//__________________________________________________________________________

_rsi_len = input(14, title="RSI length")
_rsi_signal_len = input(20, title="RSI signal length")

//_________________________________________________________________________
//MAM Add PSAR
PSAR_start = input(0.02)
PSAR_increment = input(0.02)
PSAR_maximum = input(0.2)

psar = sar(PSAR_start, PSAR_increment, PSAR_maximum)
//_________________________________________________________________________

_ema1 = ema(close, _ema_len1)
_ema2 = ema(close, _ema_len2)

//_________________________________________________________________________
//MAM add SMA
//_sma1 = ema(close, _sma_len1)
//_sma2 = ema(close, _sma_len2)
//_________________________________________________________________________

_macd = ema(close, _macd_fast) - ema(close, _macd_slow)
_macd_signal = ema(_macd, _macd_signal_len)

_rsi = rsi(close, _rsi_len)
_rsi_signal = ema(_rsi, _rsi_signal_len)


//PLOT SMA
plot(SMA1, color=#B71C1C, title="SMA1", linewidth=lineWidth)
plot(SMA2, color=#FFFF00, title="SMA2", linewidth=lineWidth)
plot(SMA3, color=#5b34ff, title="SMA3", linewidth=lineWidth)
plot(SMA4, color=#d7d7d7, title="SMA4", linewidth=lineWidth)


//PLOT PSAR
plot(psar, "ParabolicSAR", style=plot.style_cross, color=#3A6CA8)

//plot(_rsi, color=color.yellow)
//plot(_rsi_signal, color=color.green)
//plot(_macd, color=color.blue)
//plot(_macd_signal, color=color.red)


longCondition = close > _ema1 and close > _ema2 and _macd > _macd_signal and _rsi > _rsi_signal
if (longCondition)
    strategy.entry("Buy",strategy.long)

shortCondition = close < _ema1 and close <_ema2 and _macd < _macd_signal and _rsi < _rsi_signal
if (shortCondition)
    strategy.entry("Sell",strategy.short)
Detail
https://www.fmz.com/strategy/443246
Last Modified
2024-03-01 12:23:38
