Name
KP移动平均趋势策略Heyping-Moving-Average-Trend-Strategy
Author
ChaoZhang
Strategy Description
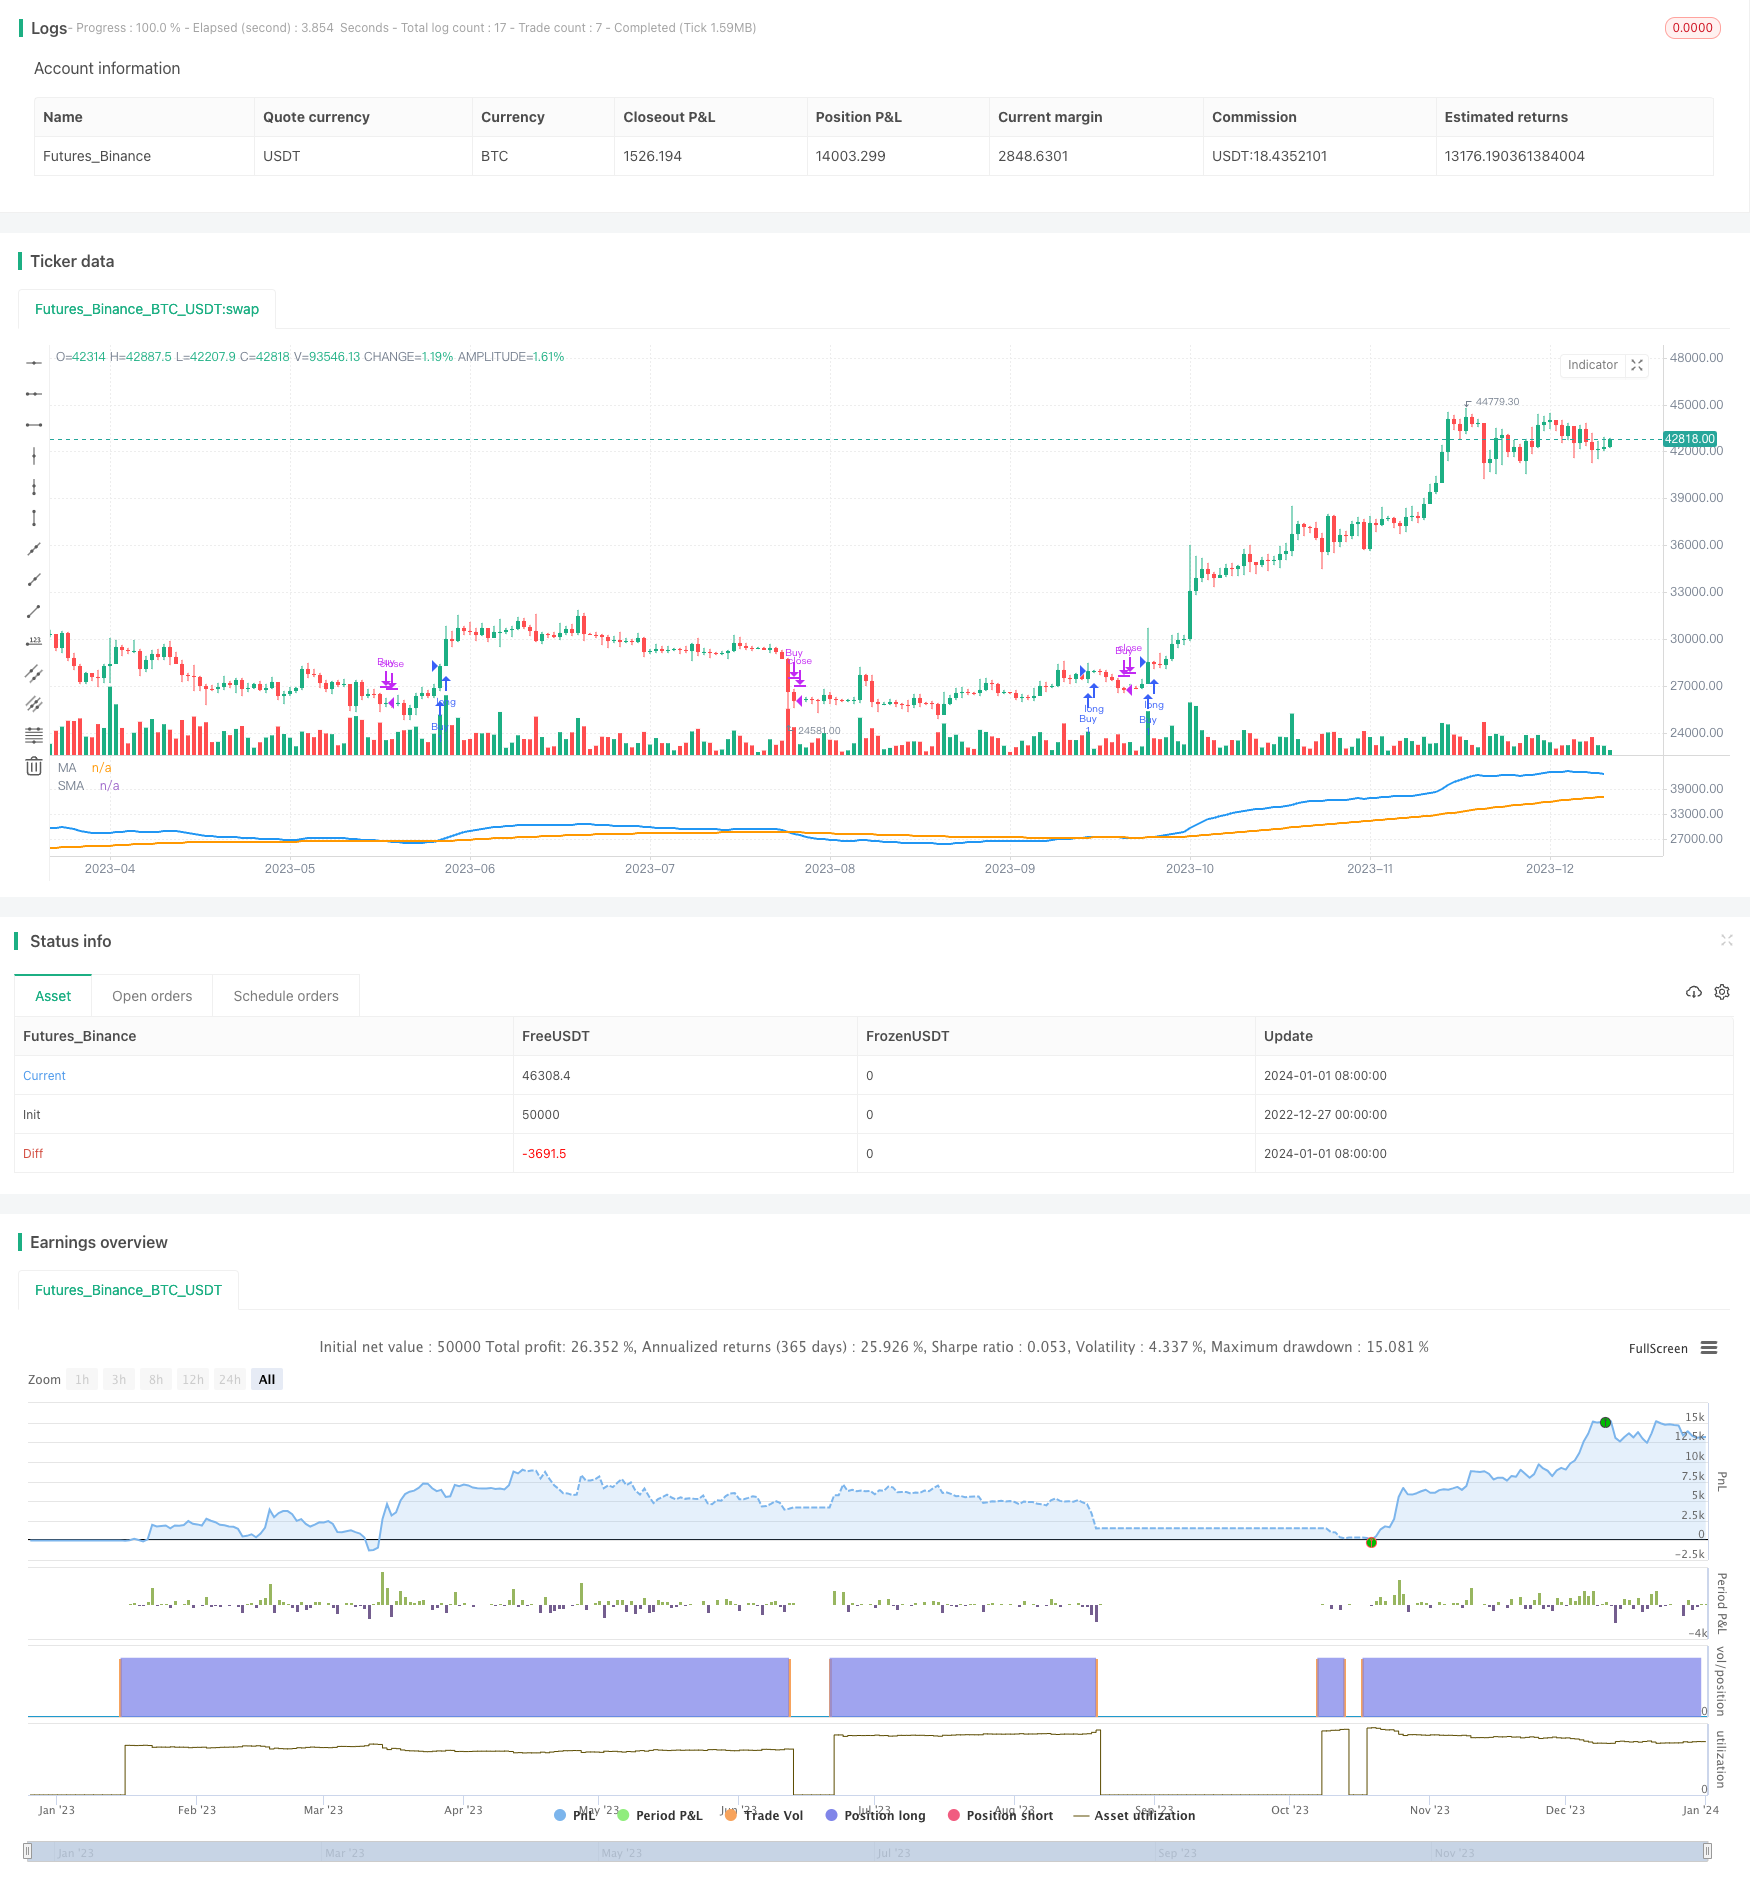
KP移动平均趋势策略是一种技术分析指标组合的趋势跟踪策略。该策略主要利用平均线指标识别价格趋势方向,采用均线交叉信号判断入场 timing。策略可在 TradingView 平台上实现,通过参数优化获得较好的表现。
KP策略主要运用三类指标:
-
平均线:快速EMA 和慢速SMA。EMA反应价格变化更为敏感,SMA更稳定。两者配合使用,快速EMA交叉慢速SMA产生交易信号。
-
希肯阿修蜡烛图:特殊的烛形图,有更清晰的趋势特征。策略中用于绘制EMA均线的价格数据来源。
-
对数变换选项:对价格数据做可选的对数变换,更便于观察百分比价格变动。
具体交易逻辑是,快速EMA向上突破慢速SMA时做多;向下跌破时平仓。该策略属于典型的趋势跟踪策略。
- 参数可调性强,能适应不同品种和交易时段
- 可视化指标配合,形成清晰易读的趋势交易策略
- 增加对数变换可选项,应对更加波动的品种
- 希肯阿修蜡烛图更好判定趋势方向
- 整合停损机制控制风险
- 趋势反转风险,需要及时止损
- 参数优化需谨慎,避免过拟合
- 交易品种和时段选择对策略表现影响大
- 需进行充分回测确保参数稳健性
- 增加自适应参数优化模块
- 整合更多指标过滤假信号
- 增加算法交易模块,实现自动化下单
- 结合机器学习技术判断关键点
- 优化止损策略,实现动态跟踪止损
KP移动平均趋势策略整合多种技术指标判断趋势方向,参数设置灵活,可视化效果出色。该策略可作为基础趋势跟踪策略,进行适当优化调整后用于实盘交易。但用户须谨记,任何策略都不能完美预测市场,需控制风险,审慎操作。
||
The Heyping Moving Average Trend Strategy is a technical indicator combo strategy designed to track price trends. It generates entry and exit signals based on moving average crossovers to time the market. The strategy can be implemented on the TradingView platform and optimized for performance.
The KP strategy utilizes three types of indicators:
-
Moving Averages: A faster EMA and slower SMA. The EMA reacts faster to price changes while the SMA is more stable. Crossovers between the two produce trade signals.
-
Heiken Ashi Candles: Special candlestick charts with clearer trend definition. Used as the price data source for plotting the EMAs.
-
Log Transformation: An option to log transform price data to better visualize percentage changes.
The specific logic is to go long when the faster EMA crosses above the slower SMA, and to exit the position when the reverse crossover happens. This strategy belongs to the trend following category.
- Highly customizable parameters catering to different products and timeframes
- Visual indicators combined into an easy-to-read system
- Log transformation option to handle volatile instruments
- Heiken Ashi candles offer superior trend determination
- Integrates stop loss to control risk
- Trend reversal risk. Timely stop loss required
- Careful parameter optimization to avoid overfitting
- Instrument and timeframe selections greatly impact results
- Robustness must be validated through backtesting
- Add adaptive parameter optimization module
- Incorporate more filters to avoid false signals
- Build algo trading module for automation
- Apply machine learning models at inflection points
- Enhance stop loss strategy for dynamic trailing stop loss
The Heyping Moving Average Trend Strategy combines various technical indicators to define trend directions with flexible configurations and great visualization. It can serve as a baseline trend following strategy and be further tuned for live trading while noting no strategy is perfect. Risk management is key.
[/trans]
Strategy Arguments
| Argument | Default | Description |
|---|---|---|
| v_input_1 | D | Heikin Ashi Candle Time Frame |
| v_input_2 | false | Heikin Ashi Candle Time Frame Shift |
| v_input_3 | W | Heikin Ashi EMA Time Frame |
| v_input_4 | false | Heikin Ashi EMA Time Frame Shift |
| v_input_5 | 10 | Heikin Ashi EMA Period |
| v_input_6 | false | Heikin Ashi EMA Shift |
| v_input_7 | 100 | Slow EMA Period |
| v_input_8 | false | Slow EMA Shift |
| v_input_9 | false | Log Transform |
| v_input_10 | true | Stop Loss |
| v_input_11 | true | Show Plots |
Source (PineScript)
/*backtest
start: 2022-12-27 00:00:00
end: 2024-01-02 00:00:00
period: 1d
basePeriod: 1h
exchanges: [{"eid":"Futures_Binance","currency":"BTC_USDT"}]
*/

//@version=5
strategy("KP 15min Strategy", shorttitle="KP15", overlay=false)

res = input("D",title="Heikin Ashi Candle Time Frame")
hshift = input(0, title="Heikin Ashi Candle Time Frame Shift")
res1 = input("W",title="Heikin Ashi EMA Time Frame")
mhshift = input(0, title="Heikin Ashi EMA Time Frame Shift")
fama = input(10, title="Heikin Ashi EMA Period")
test = input(0, title="Heikin Ashi EMA Shift")
sloma = input(100, title="Slow EMA Period")
slomas = input(0, title="Slow EMA Shift")
logtransform = input(false, title="Log Transform")
stoploss = input(true, title="Stop Loss")
showplots = input(true, title="Show Plots")

ha_t = request.security(syminfo.tickerid, res, expression=hlc3)
ha_close = request.security(syminfo.tickerid, res, expression=logtransform ? math.log(close[hshift]) : close[hshift])
mha_close = request.security(syminfo.tickerid, res1, expression=logtransform ? math.log(close[mhshift]) : close[mhshift])

fma = ta.ema(mha_close[test], fama)
sma = ta.ema(ha_close[slomas], sloma)

plot(showplots ? (logtransform ? math.exp(fma) : fma) : na, title="MA", color=color.new(color.blue, 0), linewidth=2, style=plot.style_line)
plot(showplots ? (logtransform ? math.exp(sma) : sma) : na, title="SMA", color=color.new(color.orange, 0), linewidth=2, style=plot.style_line)

golong = ta.crossover(fma, sma)
exitLong = ta.crossunder(fma, sma)

if (golong)
    strategy.entry("Buy", strategy.long)

if (exitLong)
    strategy.close("Buy")
Detail
https://www.fmz.com/strategy/437508
Last Modified
2024-01-03 12:18:29
