Name
黄金分割移动平均线交易策略Golden-Ratio-Moving-Average-Trading-Strategy
Author
ChaoZhang
Strategy Description
[trans]
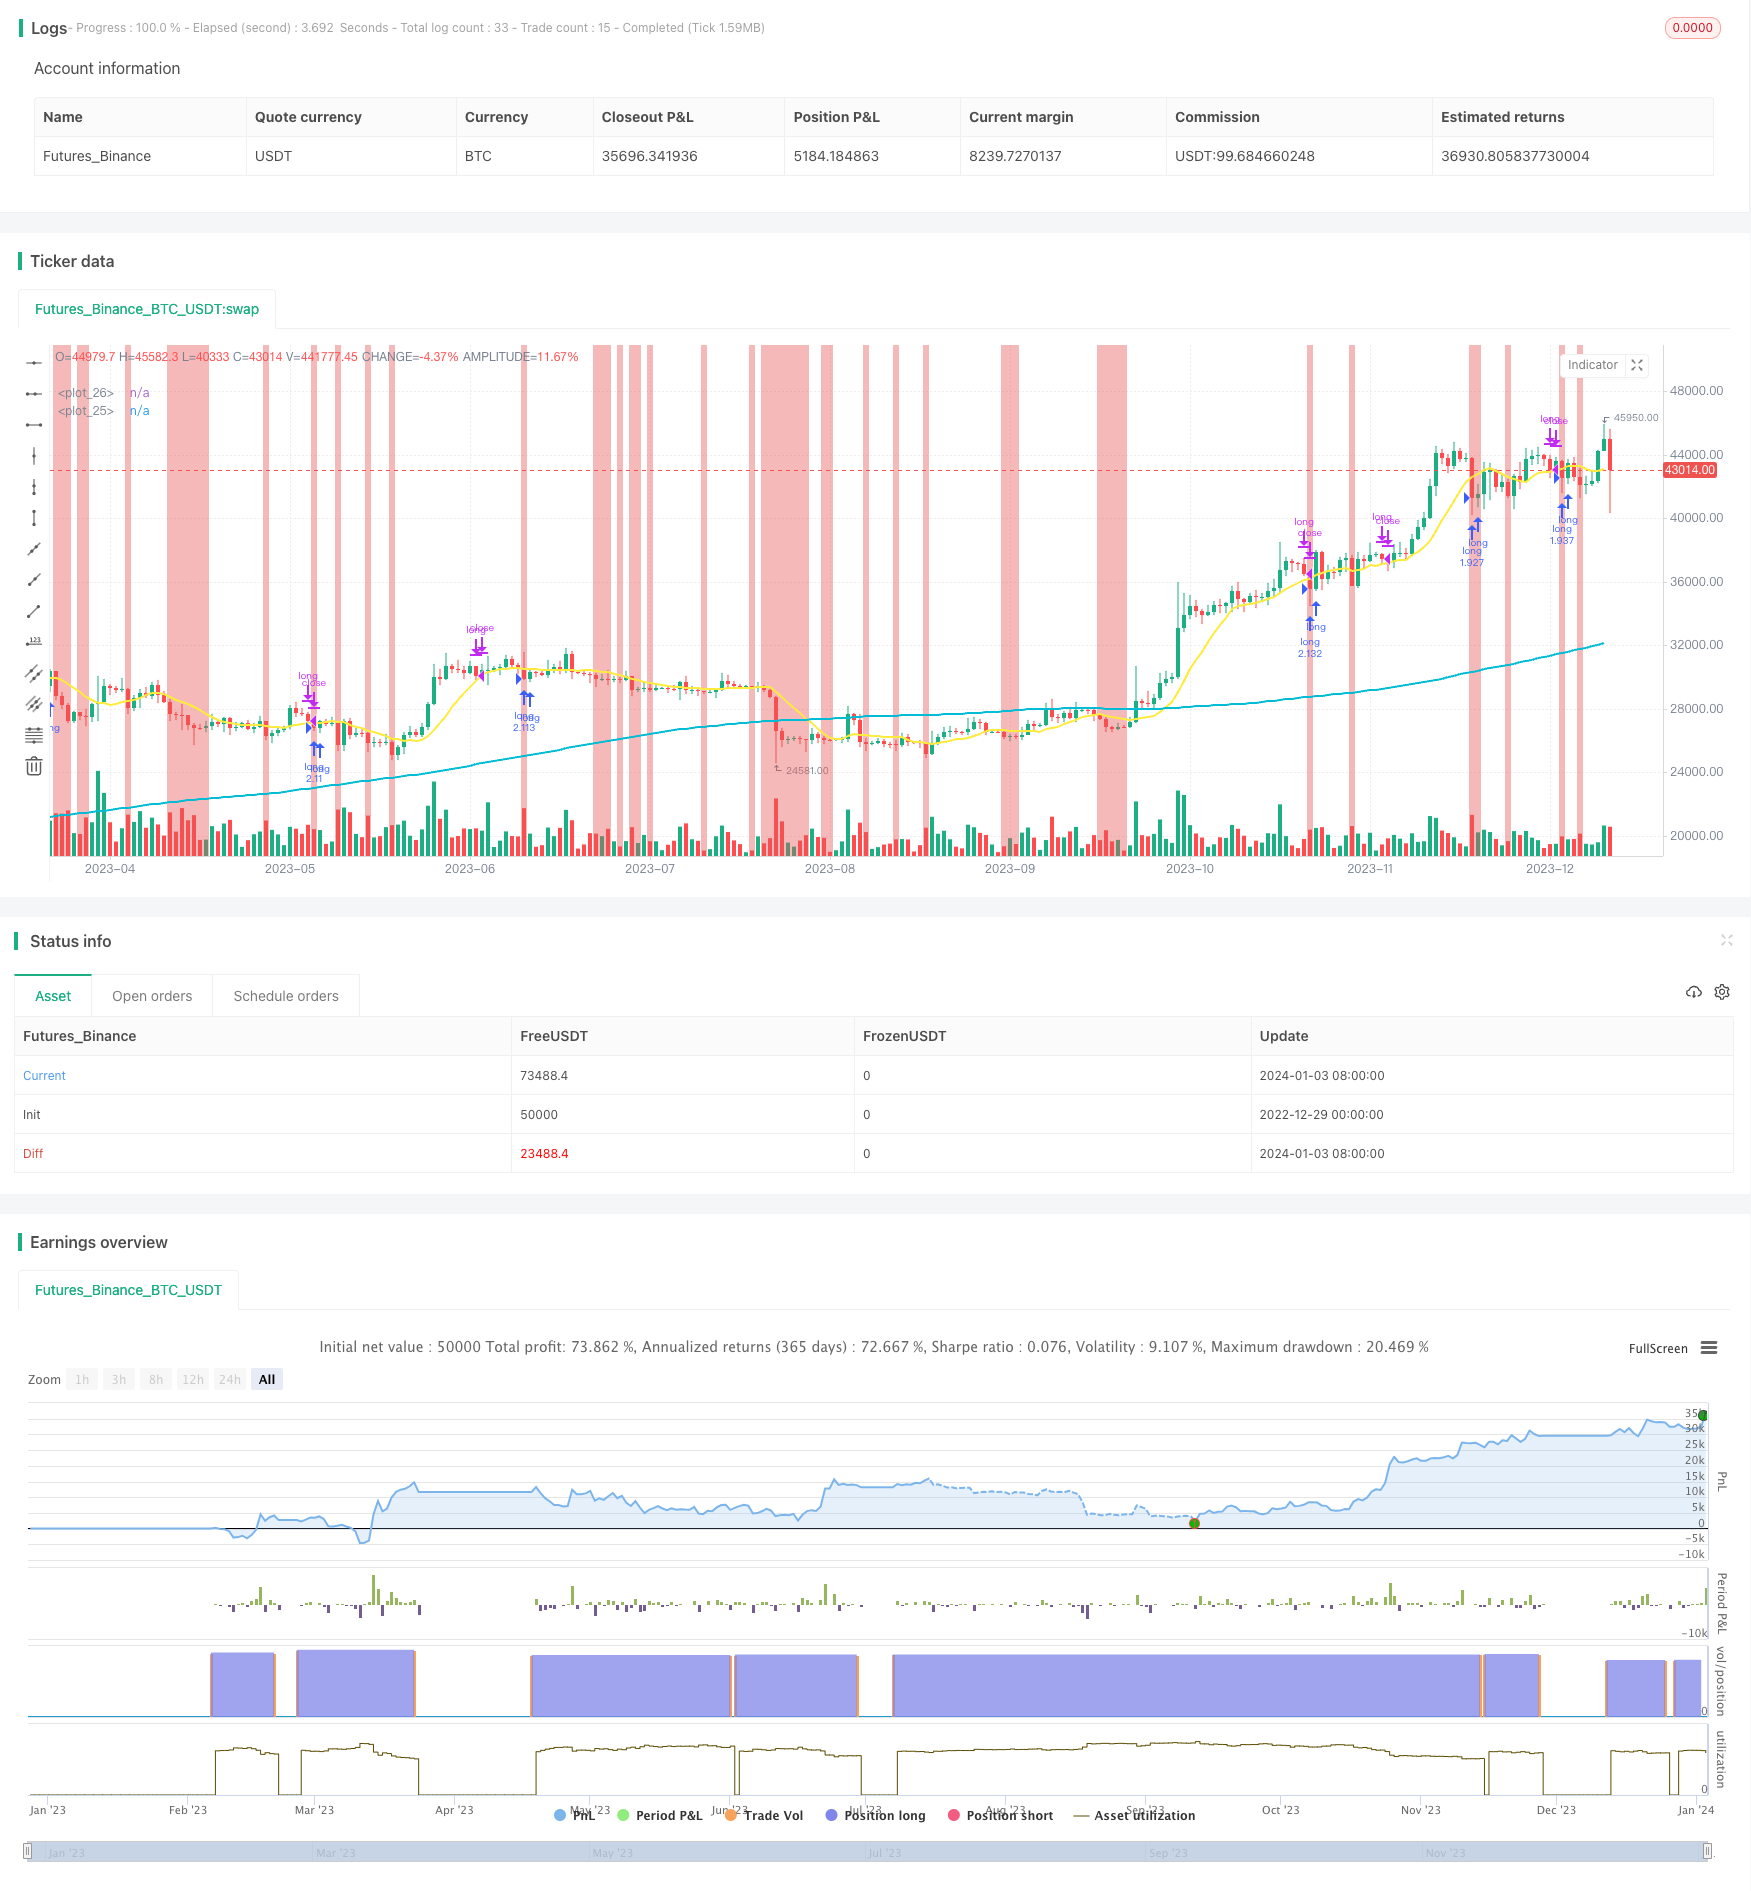
黄金分割移动平均线交易策略是一种试图利用长短期移动平均线的黄金交叉作为交易信号的量化交易策略。该策略同时结合RSI指标避免在局部高位开仓,以控制风险。
该策略主要基于两个移动平均线:200日线作为长期均线,10日线作为短期均线。当短期均线上穿长期均线时产生买入信号;当短期均线下穿长期均线时产生卖出信号。这就是著名的“黄金交叉”。该策略同时结合RSI指标,如果RSI小于30就会触发策略只在超卖区开仓。
具体来说,如果满足以下条件就会开多头仓位:
- 10日均线上穿200日均线
- 当前无持仓
- RSI小于30
平仓条件如下:
- 止损:价格跌破开仓价一定比例(可设置)时止损
- 止盈:价格超过一定比例(可设置)时止盈
该策略具有以下优势:
- 利用了移动平均线的黄金交叉信号,这是一种经典且有效的技术指标交易信号
- 结合RSI避免在高点买入,可以一定程度控制风险
- 有止损和止盈设置,可以锁定利润,规避风险
该策略也存在一些风险:
- 移动平均线策略容易产生错误信号和掉头
- RSI在一些强势行情中会失效
- 止损设置过小可能导致超短线交易而频繁停损
为降低这些风险,可以考虑以下几点优化措施:
- 调整均线参数,或者加入更多均线
- 结合其他指标确认RSI信号
- 调整止损止盈参数设定
该策略还有进一步优化的空间:
- 增加更多指标过滤信号,避免错误信号
- 优化移动平均线参数
- 结合波动率指标设定动态止损
- 加入机器学习模型判断市场状态
- 采用算法自动优化参数
黄金分割移动平均线交易策略整体来说是一种简单有效的趋势跟踪策略。它利用经典的均线交叉信号产生交易机会,并设有止损止盈来控制风险。该策略可以通过多指标组合、参数优化、机器学习等手段进行进一步改进,从而获得更好的策略效果。
||
The golden ratio moving average trading strategy is a quantitative trading strategy that attempts to use the golden cross of short-term and long-term moving averages as trading signals. The strategy also incorporates the RSI indicator to avoid opening positions at local highs in order to control risks.
The strategy is mainly based on two moving averages: the 200-day MA as the long-term MA and the 10-day MA as the short-term MA. A buy signal is generated when the short-term MA crosses over the long-term MA; A sell signal is generated when the short-term MA crosses below the long-term MA. This is the famous "golden cross". The strategy also incorporates the RSI indicator so that the strategy only opens long positions in the oversold area when RSI is less than 30.
Specifically, a long position will be opened if the following conditions are met:
- 10-day MA crosses above 200-day MA
- Currently no position
- RSI less than 30
The closing position conditions are as follows:
- Stop loss: stop loss when the price falls below a certain percentage (adjustable) of the opening price
- Take profit: take profit when the price exceeds a certain percentage (adjustable)
The strategy has the following advantages:
- It utilizes the golden cross signal of moving averages, which is a classic and effective technical indicator trading signal
- Incorporating RSI avoids buying at the highs, which can control risks to some extent
- With stop loss and take profit settings, it can lock in profits and avoid risks
The strategy also has some risks:
- Moving average strategies are prone to generating wrong signals and whipsaws
- RSI can fail in some strong trending markets
- If the stop loss is set too small, it may lead to ultra short-term trading and frequent stop loss activation
To reduce these risks, the following optimization measures can be considered:
- Adjust the MA parameters, or add more MAs
- Incorporate other indicators to confirm RSI signals
- Adjust stop loss and take profit parameter settings
There is room for further optimization of the strategy:
- Increase more indicator filters to avoid wrong signals
- Optimize moving average parameters
- Incorporate volatility indicators to set dynamic stops
- Add machine learning models to judge market conditions
- Use algorithms to automatically optimize parameters
In summary, the golden ratio moving average trading strategy is a simple and effective trend following strategy. It generates trading opportunities using classic MA crossover signals and has stops to control risks. The strategy can be further improved through multi-indicator combinations, parameter optimization, machine learning, etc. to obtain better strategy performance.
[/trans]
Strategy Arguments
| Argument | Default | Description |
|---|---|---|
| v_input_int_1 | 200 | (?パラメータ)長期移動平均BASE200 |
| v_input_int_2 | 10 | 長期移動平均BASE10 |
| v_input_int_3 | 20 | 損切の割合% |
| v_input_int_4 | 5 | 利食いの割合% |
| v_input_1 | timestamp(01 Jan 2018 13:30 +0000) | (?期間)バックテストを始める日 |
| v_input_2 | timestamp(1 Jan 2099 19:30 +0000) | バックテスを終わる日 |
Source (PineScript)
/*backtest
start: 2022-12-29 00:00:00
end: 2024-01-04 00:00:00
period: 1d
basePeriod: 1h
exchanges: [{"eid":"Futures_Binance","currency":"BTC_USDT"}]
*/

// This source code is subject to the terms of the Mozilla Public License 2.0 at https://mozilla.org/MPL/2.0/
// © tsujimoto0403

//@version=5
strategy("聖杯", overlay=true,default_qty_type=strategy.percent_of_equity,
     default_qty_value=100)

//ユーザーインプットの準備
malongperiod=input.int(200,"長期移動平均BASE200",group = "パラメータ")
mashortperiod=input.int(10,"長期移動平均BASE10",group = "パラメータ")
stop=input.int(20,title = "損切の割合%",group = "パラメータ")
profit=input.int(5,title = "利食いの割合%",group = "パラメータ")
startday=input(title="バックテストを始める日", defval=timestamp("01 Jan 2018 13:30 +0000"), group="期間")
endday=input(title="バックテスを終わる日", defval=timestamp("1 Jan 2099 19:30 +0000"), group="期間")

//使う変数
var float stopprice=0
var float takeprofit=0

//とりあえず使うインジケーターをプロット
malong=ta.sma(close,malongperiod)
mashort=ta.sma(close,mashortperiod)


plot(malong,color=color.aqua,linewidth = 2)
plot(mashort,color=color.yellow,linewidth = 2)
bgcolor(ta.rsi(close,3)<30?color.rgb(229, 86, 86, 48):na)

//期間条件
datefilter = true

//エントリー条件
if close>malong and close<mashort and strategy.position_size == 0 and datefilter and ta.rsi(close,3)<30
    strategy.entry(id="long", direction=strategy.long)

if strategy.position_size>0
    strategy.exit(id="long",stop=(1-0.01*stop)*strategy.position_avg_price)

//売り
if  strategy.position_size > 0 and close>mashort and close<low[1]
    strategy.close(id ="long")
Detail
https://www.fmz.com/strategy/437774
Last Modified
2024-01-05 14:21:52
