Name
量化交易策略-开仓量化趋势跟踪Quantitative-Trading-Strategy-Quantity-Trend-Tracking-Opening
Author
ChaoZhang
Strategy Description
[trans]
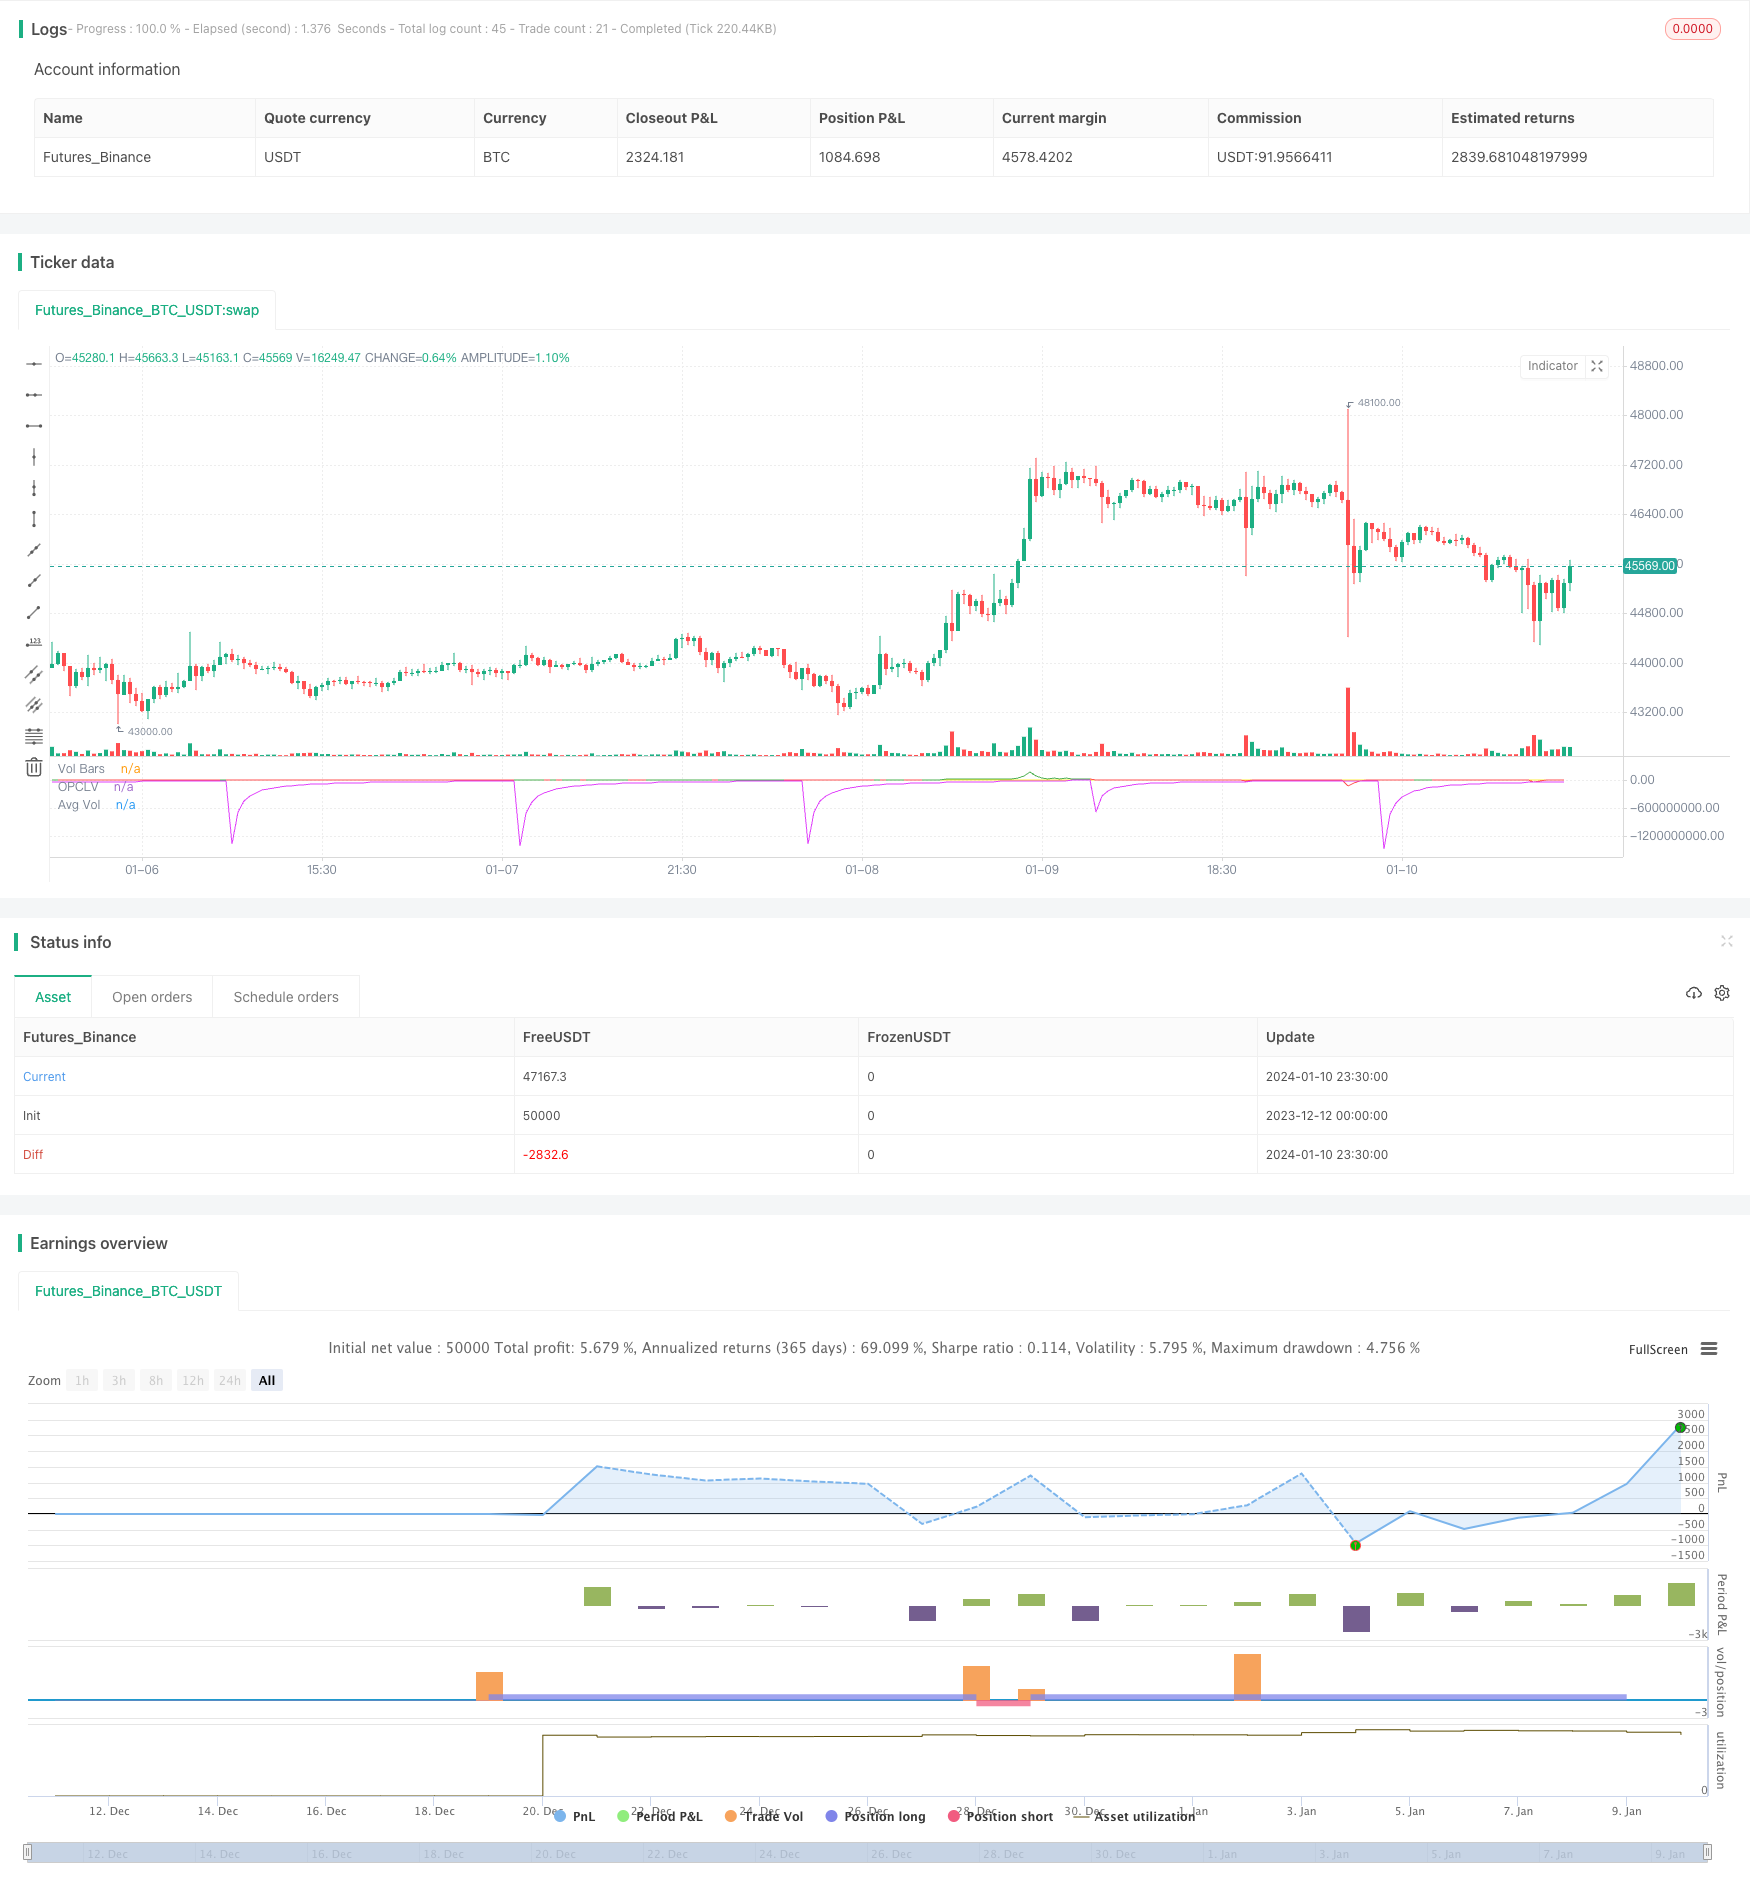
该策略通过追踪价格变动趋势并结合交易量变化情况,实现发现量化趋势的自动开仓操作。策略运用均线系统判断价格变化趋势,再结合交易量的同向变化作为开仓确认信号。
量化交易策略-开仓量化趋势跟踪的核心逻辑基于跟踪价格变动趋势和交易量变化的匹配关系。具体来说,策略使用收盘价减去开盘价的差价作为价格变化量,再乘以当日交易量得到价格与量的联合曲线。该联合曲线能同时反映价格变化趋势和交易量 accompanies 关系。然后计算该联合曲线的均线,作为量化趋势基准线。当联合曲线上穿其均线时产生买入信号,下穿其均线时产生卖出信号,从而实现量化追踪价格趋势变化的开仓操作。
该策略结合价格变动趋势和交易量变化情况,能够有效过滤掉一些量价不匹配的假趋势,减少开仓风险,提高开仓精确度。与纯价格技术指标相比,量化追踪效果更佳。该策略还使用均线系统设定动态基准线,能够自动适应市场环境的变化,灵活度较高。
该策略主要依赖价格与量关系判定量化趋势的合理性,如果价格和量之间变得不匹配,会导致误判风险的提高。此外,均线参数设置不当也会影响策略效果。需要针对不同品种和市场环境进行优化测试。
可以考虑加入更多过滤器优化策略,例如波动率指标判定趋势质量,引入情绪指标判断市场心理面情况等。此外也可以测试不同均线体系下策略效果的变化,寻找最佳参数组合。加入机器学习模型训练判断规则也是后续的优化方向。
该量化交易策略基于价格与交易量关系的跟踪判断自动开仓,通过量化匹配价格趋势与交易热度,可以有效过滤无效信号,提高开仓成功率。策略优化空间还很大,值得继续研究改进。
||
This strategy realizes the automatic opening operation of discovering quantity trends by tracking price movement trends and combined with changes in trading volume. The strategy uses the moving average system to judge the price change trend, and then combines the change of trading volume in the same direction as the opening confirmation signal.
The core logic of the quantitative trading strategy quantity trend tracking opening is based on tracking the matching relationship between price movement trends and changes in trading volume. Specifically, the strategy uses the difference between the closing price and the opening price as the price change, and then multiplies it by the trading volume of the day to obtain the price and volume joint curve. This joint curve can reflect the price change trend and trading volume accompanies the relationship at the same time. Then calculate the moving average of this joint curve as the quantitative trend benchmark. When the joint curve penetrates its moving average, a buy signal is generated. When it falls below its moving average, a sell signal is generated, thereby realizing the opening operation of quantitative tracking of price trend changes.
This strategy combines price movement trends and changes in trading volume to effectively filter out some price-insensitive false trends and reduce opening risks and improve opening accuracy. Compared with pure price technical indicators, the effect of quantitative tracking is better. This strategy also uses the moving average system to set dynamic benchmark lines, which can automatically adapt to changes in market conditions and has high flexibility.
This strategy mainly relies on the price-volume relationship to determine the reasonableness of the quantitative trend. If the relationship between price and volume becomes unmatched, it will lead to an increase in misjudgment risks. In addition, improper setting of moving average parameters will also affect strategy effectiveness. Need to be optimized and tested for different varieties and market environments.
Consider joining more filters to optimize strategies, such as using volatility indicators to determine trend quality, introducing sentiment indicators to determine market psychology, and so on. It is also possible to test the change in strategy effectiveness under different moving average systems to find the optimal parameter portfolio. Adding machine learning model training to judge rules is also the direction for follow-up optimization.
This quantitative trading strategy realizes automatic opening based on tracking and judging the price trend and trading volume relationship, by quantifying matching price trends with trading enthusiasm, it can effectively filter out invalid signals and improve the success rate of opening. There is still a lot of room for optimization of strategies, which is worth continuing research and improvement.
[/trans]
Strategy Arguments
| Argument | Default | Description |
|---|---|---|
| v_input_timeframe_1 | resolution | |
| v_input_timeframe_2 | D | resolution |
| v_input_1 | 20 | L for Vol |
Source (PineScript)
/*backtest
start: 2023-12-12 00:00:00
end: 2024-01-11 00:00:00
period: 30m
basePeriod: 15m
exchanges: [{"eid":"Futures_Binance","currency":"BTC_USDT"}]
*/

// This source code is subject to the terms of the Mozilla Public License 2.0 at https://mozilla.org/MPL/2.0/
// © avsr90

//@version=5
strategy(title="Lp-Op vol",shorttitle="LPV", max_bars_back = 5000,overlay=false,format=format.volume )

//Resolutions

Resn=input.timeframe(defval="",title="resolution")
Resn1=input.timeframe(defval="D",title="resolution")

//Intraday Open and Last Price and Last price- Open Price calculations.

Last_Price=math.round_to_mintick(close)
Open_Price = request.security(syminfo.tickerid ,Resn1,close[1],barmerge.gaps_off, barmerge.lookahead_on)
Op_Cl=math.round_to_mintick(Last_Price-Open_Price)


//length from Intra Day Open Price

Nifnum= ta.change(Open_Price)
Length_Intraday=int(math.max(1, nz(ta.barssince(Nifnum)) + 1))

//Input for Length for Volume

Length_Vol=input(defval=20, title="L for Vol")

// Last Price- Open price Volume, Average Intraday Last price-Open Price Volume
//and  Volume Bars  calculations.

Op_Cl_Vol=(Op_Cl*volume)
Avg_Vol_Opcl=ta.sma(Op_Cl_Vol,Length_Intraday)
Vol_Bars=ta.sma(volume,Length_Vol)

//Plots
plot(Op_Cl_Vol,color=Op_Cl_Vol>0 ? color.green:color.red,title="OPCLV")
plot(Avg_Vol_Opcl, title="Avg Vol", color=color.fuchsia)
plot(Vol_Bars, title="Vol Bars", color=color.yellow)

//Strategy parameters

startst=timestamp(2015,10,1)

strategy.entry("lo",strategy.long,when= ta.crossover(Op_Cl_Vol,Avg_Vol_Opcl) and ta.crossover(volume,Vol_Bars))
strategy.entry("sh",strategy.short,when=ta.crossunder(Op_Cl_Vol,Avg_Vol_Opcl)and ta.crossunder(volume,Vol_Bars ))
Detail
https://www.fmz.com/strategy/438500
Last Modified
2024-01-12 14:46:04
