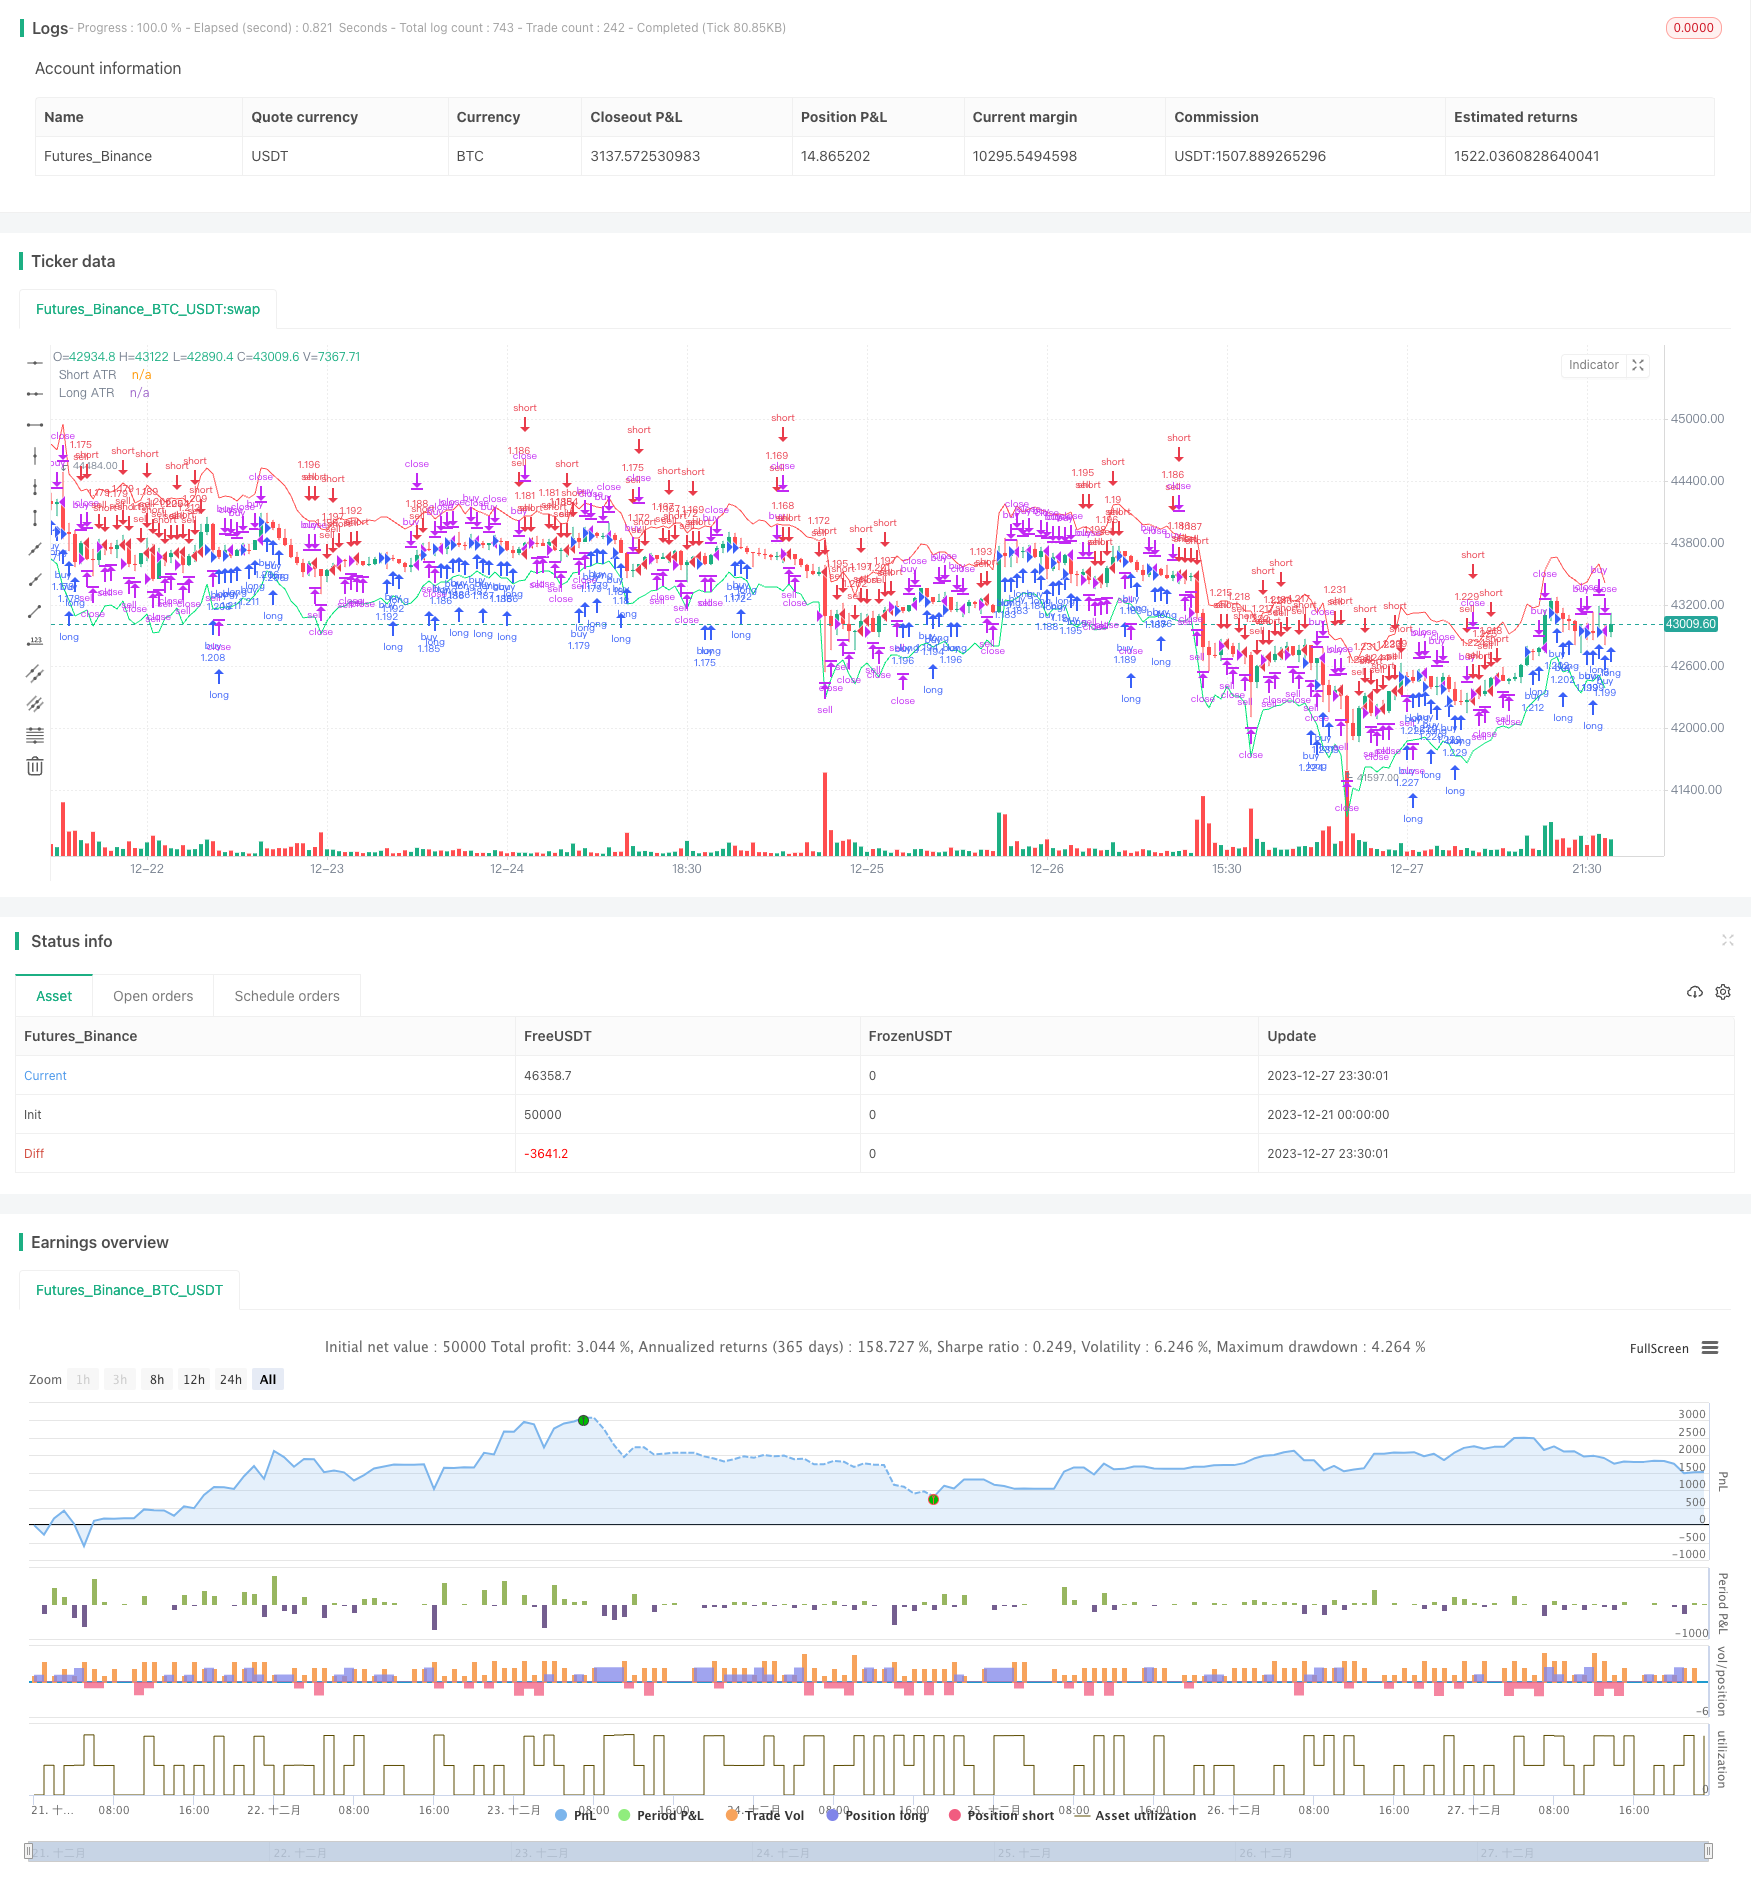
Name
逆向线性回归策略Reverse-Linear-Regression-Strategy
Author
ChaoZhang
Strategy Description
[trans]
逆向线性回归策略是一种基于价格波动的反转交易策略。它结合了线性回归分析和AVERAGE TRUE RANGE指标,设定了连续上涨K线或连续下跌K线的条件,在线性回归分析判断价格反转时,进行反向操作。
该策略首先计算出线性回归的斜率。当线性回归斜率大于等于0时,表示价格处于上升趋势;当小于0时,表示价格下降趋势。同时结合最后一个K线的收盘价与开盘价的对比,判断最后一个K线是上涨还是下跌。在线性回归斜率大于等于0,且最后一个K线收盘价低于开盘价时,产生买入信号;在线性回归斜率小于0,且最后一个K线收盘价高于开盘价时,产生卖出信号。
通过连续上涨K线个数和连续下跌K线个数的设置,可以控制交易频率。在判断到连续上涨K线达到设定个数时,线性回归斜率小于0的情况下产生卖出信号,实现高点附近反转交易;在判断到连续下跌K线达到设定个数时,线性回归斜率大于等于0的情况下产生买入信号,实现低点附近反转交易。
该策略结合了趋势和反转交易,能够在关键点附近进行反转操作,从而获取价格调整后的优势。线性回归分析提供了判断价格总体趋势的手段,避免在价格还在持续上涨或下跌的时候就反转做空或做多。连续K线条件控制了交易频率,在关键反转点附近进行操作。
相比简单的反转策略,该策略结合多种技术指标,对交易时机把控更加准确,可以有效规避虚假突破的风险,提高获利概率。
该策略主要面临反转失败的风险。如果判断到价格反转信号后,价格继续保持原有趋势运行,则会造成损失。此外,线性回归分析和ATR指标的参数设置也会对策略收益产生影响。
可以通过止损来控制单笔损失。合理评估市场波动频率,适当调整连续K线个数,降低交易频率。优化线性回归周期参数和ATR参数,使之更符合不同品种的特点。
该策略可以从以下几个方面进行优化:
-
增加其他技术指标判断,结合不同时间周期指标,提高判断准确性。例如加入MACD、Bollinger Band等。
-
增加机器学习成分,通过算法自动优化参数,并动态调整交易规则。
-
加入风险管理机制,例如资金管理、止损策略等,控制交易风险。
-
进行组合优化,将策略与其他非相关策略组合,降低整体回撤,提高稳定性。
-
扩展到更多品种,评估不同品种的参数设置,使策略更具普适性。
逆向线性回归策略整合多种技术指标,在判断到价格反转时机时进行反向操作,是一种有效的反转交易策略。该策略通过参数优化和风险管理的加强,可以进一步扩大获利空间,具有很大的改进潜力。作为一种典型的反转策略思路,它为我们提供了宝贵的参考。
||
The reverse linear regression strategy is a reversal trading strategy based on price fluctuations. It combines linear regression analysis and AVERAGE TRUE RANGE indicator, sets the conditions for consecutive rising K-lines or consecutive falling K-lines, and takes reverse operations when linear regression analysis judges price reversal.
The strategy first calculates the slope of linear regression. When the linear regression slope is greater than or equal to 0, it indicates that the price is in an upward trend; when it is less than 0, it indicates a downward trend in prices. At the same time, combined with the comparison between the closing price and the opening price of the last K-line, it is judged whether the last K-line rose or fell. When the linear regression slope is greater than or equal to 0 and the closing price of the last K-line is lower than the opening price, a buy signal is generated; when the linear regression slope is less than 0 and the closing price of the last K-line is higher than the opening price, a sell signal is generated.
Through the setting of the number of consecutive rising K-lines and the number of consecutive falling K-lines, the trading frequency can be controlled. When it is determined that the number of consecutive rising K-lines reaches the set number, a sell signal is generated under the condition that the linear regression slope is less than 0 to achieve reversal trading near the high point; when it is determined that the consecutive falling K-lines reach the Setting the number, when the linear regression slope is greater than or equal to 0, a buy signal is generated to achieve reversal trading near the low point.
The strategy combines trend trading and reversal trading, and can carry out reversal operations at critical points, thereby obtaining the advantage after price adjustment. Linear regression analysis provides a means to determine the overall trend of prices and avoid reversing short or long positions when prices are still rising or falling. The consecutive K-line condition controls the trading frequency and operates at critical reversal points.
Compared with simple reversal strategies, this strategy combines multiple technical indicators to control transaction timing more accurately, which can effectively avoid the risk of false breaks and increase profitability.
The main risk faced by this strategy is the failure of reversal. If it is judged that the price reversal signal, the price continues to maintain the original trend, it will cause losses. In addition, the setting of parameters of linear regression analysis and ATR indicators will also affect the strategy's income.
Stop loss can be used to control single loss. Reasonably evaluate the frequency of market fluctuations, appropriately adjust the number of consecutive K-lines, and reduce the trading frequency. Optimize the cycle parameters of linear regression and ATR parameters to make them more in line with the characteristics of different varieties.
The strategy can be optimized in the following aspects:
-
Add other technical indicators to improve judgment accuracy. For example, MACD, Bollinger Band, etc.
-
Increase machine learning components for automatic parameter optimization and dynamic adjustment of trading rules.
-
Incorporate risk management mechanisms such as capital management and stop loss strategies to control trading risks.
-
Portfolio optimization that combines strategies with other unrelated strategies to reduce overall drawdowns and improve stability.
-
Expand to more varieties, evaluate parameter settings for different varieties to make the strategy more versatile.
The reverse linear regression strategy integrates multiple technical indicators and takes reverse operations when judging the timing of price reversal. It is an effective reversal trading strategy. Through parameter optimization and enhanced risk management, the strategy can further expand profit margins and has great potential for improvement. As a typical reversal strategy idea, it provides us with valuable references.
[/trans]
Strategy Arguments
| Argument | Default | Description |
|---|---|---|
| v_input_1 | true | Sell after how many bars up? |
| v_input_2 | true | Buy after how many bars down? |
| v_input_3 | 14 | ATR Length |
| v_input_4 | 2.33 | ATR Multiplier |
| v_input_5 | 14 | Slope Length |
Source (PineScript)
/*backtest
start: 2023-12-21 00:00:00
end: 2023-12-28 00:00:00
period: 30m
basePeriod: 15m
exchanges: [{"eid":"Futures_Binance","currency":"BTC_USDT"}]
*/

//@version=4
strategy("Reverse Up/Down Strategy", currency=currency.USD, initial_capital=1000, pyramiding=2, default_qty_type=strategy.percent_of_equity, default_qty_value=100,overlay=true)

//User Options
consecutiveBarsUp   = input(title="Sell after how many bars up?",   type=input.integer, minval=1, defval=1)
consecutiveBarsDown = input(title="Buy after how many bars down?",  type=input.integer, minval=1, defval=1)
atrLength           = input(title="ATR Length",                     type=input.integer, minval=1, defval=14)
atrMult             = input(title="ATR Multiplier",                 type=input.float,   minval=0.1, defval=2.33)

//ATR Channel
adjustedATR     = sma(atr(atrLength),atrLength) * atrMult
longATR         = low - adjustedATR
shortATR        = high + adjustedATR
plot(shortATR,  title="Short ATR",  color=color.red)
plot(longATR,   title="Long ATR",   color=color.lime)


// This is the true linear regression slope rather than an approximation given by numerical differentiation
src = hlc3
len = input(defval=14, minval=1, title="Slope Length")
lrc = linreg(src, len, 0)
lrc1 = linreg(src, len,1)
lrs = (lrc-lrc1)

//Check if last candle was up or down
priceOpen = open
priceClose = close
longCondition = priceOpen > priceClose
shortCondition = priceOpen < priceClose
ups = 0.0
dns = 0.0

ups := shortCondition ? nz(ups[1]) + 1 : 0
dns := longCondition ? nz(dns[1]) + 1 : 0

if (shortCondition)
    strategy.close("buy", qty_percent=100, comment="Close")
    if (ups >= consecutiveBarsUp and lrs <= 0)
    	strategy.entry("sell", strategy.short, comment="Sell")


if (longCondition)
    strategy.close("sell", qty_percent=100, comment="Close")
    if (dns >= consecutiveBarsDown and lrs >= 0)
	    strategy.entry("buy", strategy.long, comment = "Buy")
Detail
https://www.fmz.com/strategy/437045
Last Modified
2023-12-29 17:15:07
