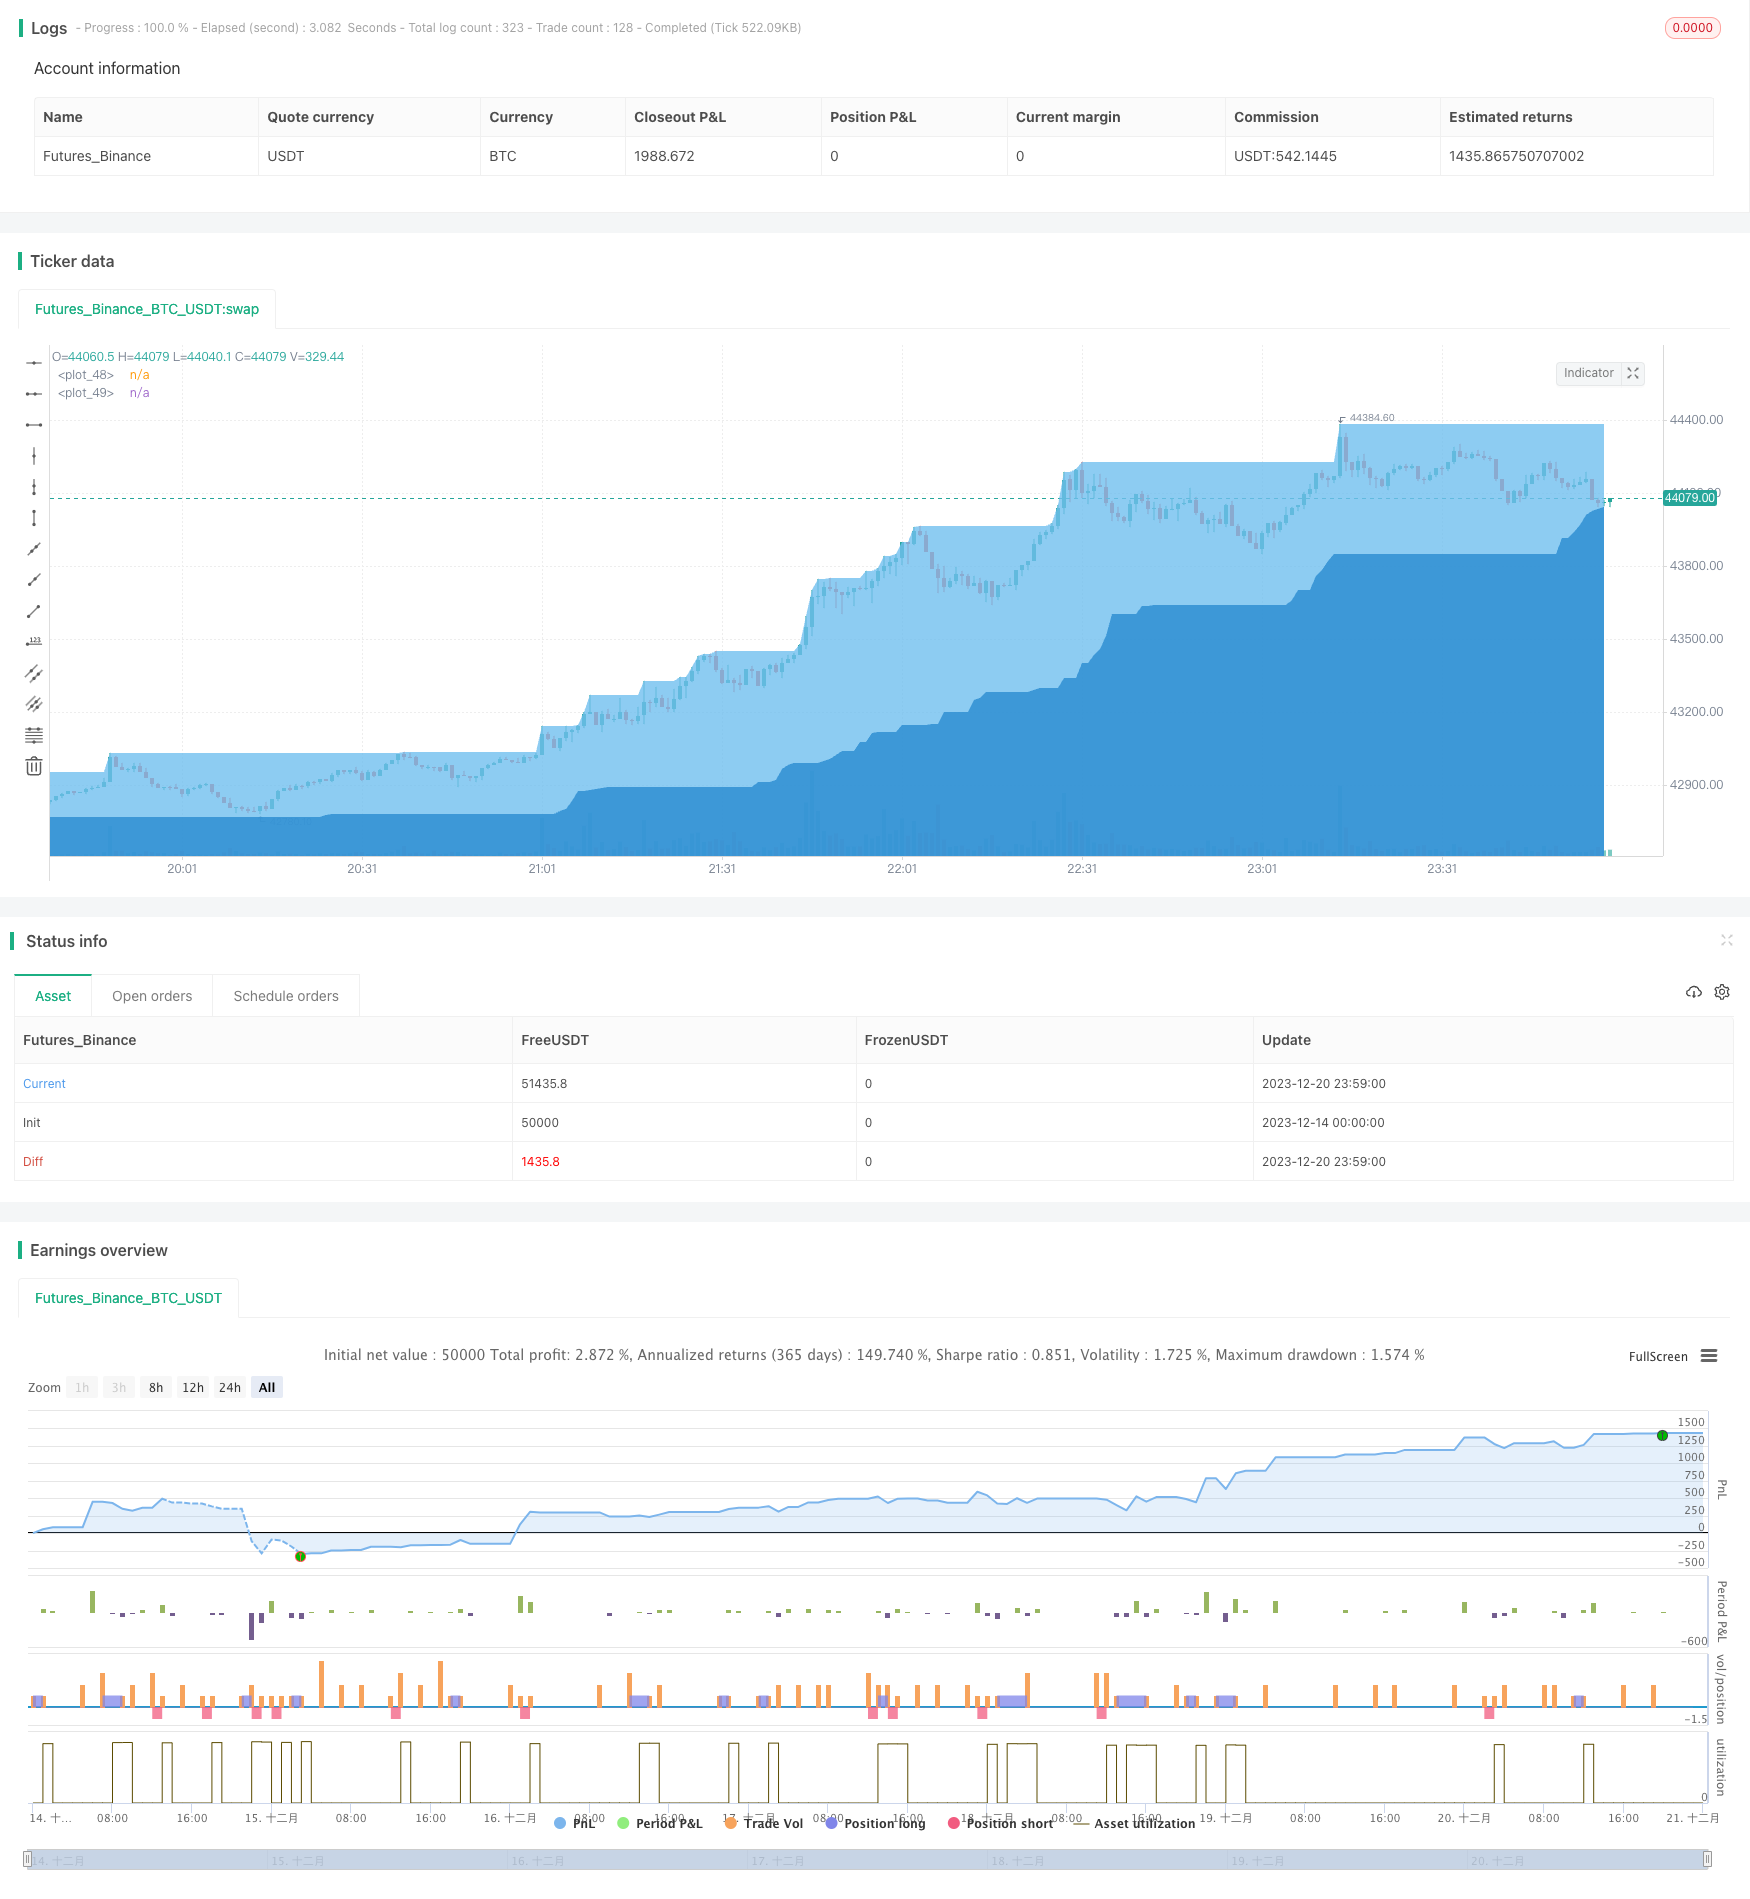
Name
趋势顺应海龟交易策略Turtle-trend-Following-Strategy
Author
ChaoZhang
Strategy Description
趋势顺应海龟交易策略是一种基于移动平均线判断趋势方向,并在趋势反转点进行交易的量化策略。该策略同时结合K线形态判定信号,在潜在反转点进行进场和止损。
该策略使用三条不同周期的EMA平均线来判断趋势方向。具体来说,分别计算15日线、120日线和220日线的EMA平均线。当15日线高于220日线时判断为看涨趋势,当15日线低于220日线时判断为看跌趋势。
在看涨趋势时,如果收盘价低于220日线,则做空;在看跌趋势时,如果收盘价高于220日线,则做多。
同时,策略还会结合K线形态来确认信号。当出现看涨的大缺口K线或看跌的大缺口K线时,则平仓止损。
该策略最大的优势在于能够顺应趋势操作,避免在没有明确信号的情况下随意做反向操作。通过多条移动平均线判断趋势,可以有效过滤市场噪音,锁定主要趋势方向。
同时,策略还会在潜在的趋势反转点进场,这时具有很好的风险回报比特征。并且结合K线形态止损,可以避免止损点过于碎片化。
该策略主要风险在于移动平均线所判断的趋势可能和实际价格走势有一定的滞后。这时就可能出现与趋势的反向操作。
此外,策略中所用到的K线形态规则也可能会失效,无法有效止损。当市场出现异常波动时,止损点可能会被直接突破,导致较大的亏损。
为降低上述风险,可以考虑调整移动平均线的周期参数,或者调整K线形态判定的比例因子,使规则更加严格。当然,也需要意识到技术分析始终无法完全规避市场风险,需要控制好仓位。
该策略可以从以下几个方面进行优化:
-
优化移动平均线的周期参数,找到更合适判断趋势的周期参数组合
-
测试不同类型的移动平均线指标,如SMA、LWMA等,寻找更符合自己风格的指标
-
调整或增加K线形态判定规则,使反转信号更加清晰可靠
-
增加止损策略,如跟踪止损、时间止损等,进一步控制单笔亏损
-
结合其他指标,如震荡指标、成交量等,丰富系统的交易信号
趋势顺应海龟交易策略整体来说是一个非常典型的趋势跟随策略。它判断趋势的方法简单易行,同时也具备一定的风险控制措施。该策略适合对趋势交易有一定了解,并希望获得稳定收益的投资者。如果能够不断优化,它也可以成为具有长期竞争优势的量化策略。
||
The turtle-trend following strategy is a quantitative strategy that determines the trend direction based on moving averages and trades at trend reversal points. The strategy also combines candlestick patterns to determine signals and enter and stop loss at potential reversal points.
The strategy uses three EMA lines of different cycles to determine the trend direction. Specifically, the 15-day, 120-day, and 220-day EMA lines are calculated. When the 15-day line is higher than the 220-day line, the uptrend is determined. When the 15-day line is lower than the 220-day line, the downtrend is determined.
When in an uptrend, if the closing price is below the 220-day line, go short; when in a downtrend, if the closing price is above the 220-day line, go long.
At the same time, the strategy also combines candlestick patterns to confirm signals. When there is a bullish big gap candlestick or a bearish big gap candlestick, the position is closed to stop loss.
The biggest advantage of this strategy is that it can follow the trend to operate, avoiding reverse operations without clear signals. By judging the trend with multiple moving averages, market noise can be effectively filtered to lock the main trend direction.
At the same time, the strategy will also enter at potential trend reversal points, which has very good risk-reward characteristics at this time. And combining candlesticks to stop loss can avoid too fragmented stop loss points.
The main risk of this strategy is that the trend determined by the moving average may lag behind the actual price movement. At this time, reverse operations against the trend may occur.
In addition, the candlestick patterns used in the strategy may also fail and cannot stop loss effectively. When there is abnormal market fluctuation, the stop loss point may be directly penetrated, resulting in greater losses.
To reduce the above risks, consider adjusting the cycle parameters of the moving average, or adjusting the proportional factor for determining the candlestick pattern to make the rules stricter. Of course, it also needs to be aware that technical analysis can never completely avoid market risk, and position size needs to be controlled.
The strategy can be optimized in the following aspects:
-
Optimize the cycle parameters of the moving average to find a more suitable combination of parameters to judge the trend
-
Test different types of moving average indicators, such as SMA, LWMA, etc., to find indicators that match your own style
-
Adjust or add candlestick judgment rules to make reversal signals clearer and more reliable
-
Add stop loss strategies, such as trailing stop loss, time stop loss, etc., to further control single loss
-
Combine other indicators, such as volatility indicators, trading volume, etc., to enrich the trading signals of the system
The turtle-trend following strategy is a very typical trend following strategy overall. Its method of judging the trend is simple and easy to implement, while also having certain risk control measures. This strategy is suitable for investors who have some understanding of trend trading and hope to obtain stable returns. If continuously optimized, it can also become a quantitative strategy with long-term competitive advantages.
[/trans]
Strategy Arguments
| Argument | Default | Description |
|---|---|---|
| v_input_3 | 50 | 计算的周期 |
| v_input_bool_1 | true | (?回测范围)启用回测时间范围限定 |
| v_input_1 | timestamp(1 Jan 2015) | 开始时间 |
| v_input_2 | timestamp(1 Jan 2040) | 结束时间 |
| v_input_int_1 | 15 | (?市场平均成本)短期市场平均成本 |
| v_input_int_2 | 120 | 中期市场平均成本 |
| v_input_int_3 | 220 | 长期市场平均成本 |
Source (PineScript)
/*backtest
start: 2023-12-14 00:00:00
end: 2023-12-21 00:00:00
period: 1m
basePeriod: 1m
exchanges: [{"eid":"Futures_Binance","currency":"BTC_USDT"}]
*/

// © Aayonga
//@version=5
strategy('帆船探险寻找传说', overlay=true)

useDateFilter=input.bool(true,title = "启用回测时间范围限定", group = "回测范围")
backtesStarDate=input(timestamp("1 Jan 2015"),title = "开始时间", group = "回测范围")
backtestEndDate=input(timestamp("1 Jan 2040"),title = "结束时间",group = "回测范围")
inTradeWindow= true


A = input(50, '计算的周期')


shallowsea = ta.highest(A)
deepsea= ta.lowest(A)

//趋势形成条件
Length1 = input.int(15, title='短期市场平均成本', minval=1, group='市场平均成本')
Length2 = input.int(120, title='中期市场平均成本', minval=1, group='市场平均成本')
Length3 = input.int(220, title='长期市场平均成本', minval=1, group='市场平均成本')
SMA1 = ta.ema(close, Length1)
SMA2 = ta.sma(close, Length2)
SMA3 = ta.sma(close, Length3)


//趋势看多
longTrend=SMA1>SMA3 and open >SMA3

shortTrend=SMA1<SMA3

bullPinBar = ((close > open) and ((open - low) > 0.66* (high - low))) or ((close < open) and ((close - low) > 0.9 * (high - low)))
bearPinBar = ((close > open) and ((high - close) > 0.75 * (high - low))) or ((close < open) and ((high - open) >0.9 * (high - low)))


if close > shallowsea[5] and shortTrend and inTradeWindow
    strategy.entry('⛵?', strategy.short)

if close < deepsea[5] and longTrend and inTradeWindow
    strategy.entry('?', strategy.long)

if  bullPinBar and inTradeWindow
    strategy.close('⛵?',comment = '?')

if bearPinBar and inTradeWindow
    strategy.close('?',comment = '?')

plot(shallowsea,style=plot.style_area, color=color.new(#71bfef, 0))
plot(deepsea, style=plot.style_area,color=color.new(#298bd1, 0))
Detail
https://www.fmz.com/strategy/436211
Last Modified
2023-12-22 11:41:30
