Name
超级ATR趋势跟踪策略Super-ATR-Trend-Following-Strategy
Author
ChaoZhang
Strategy Description
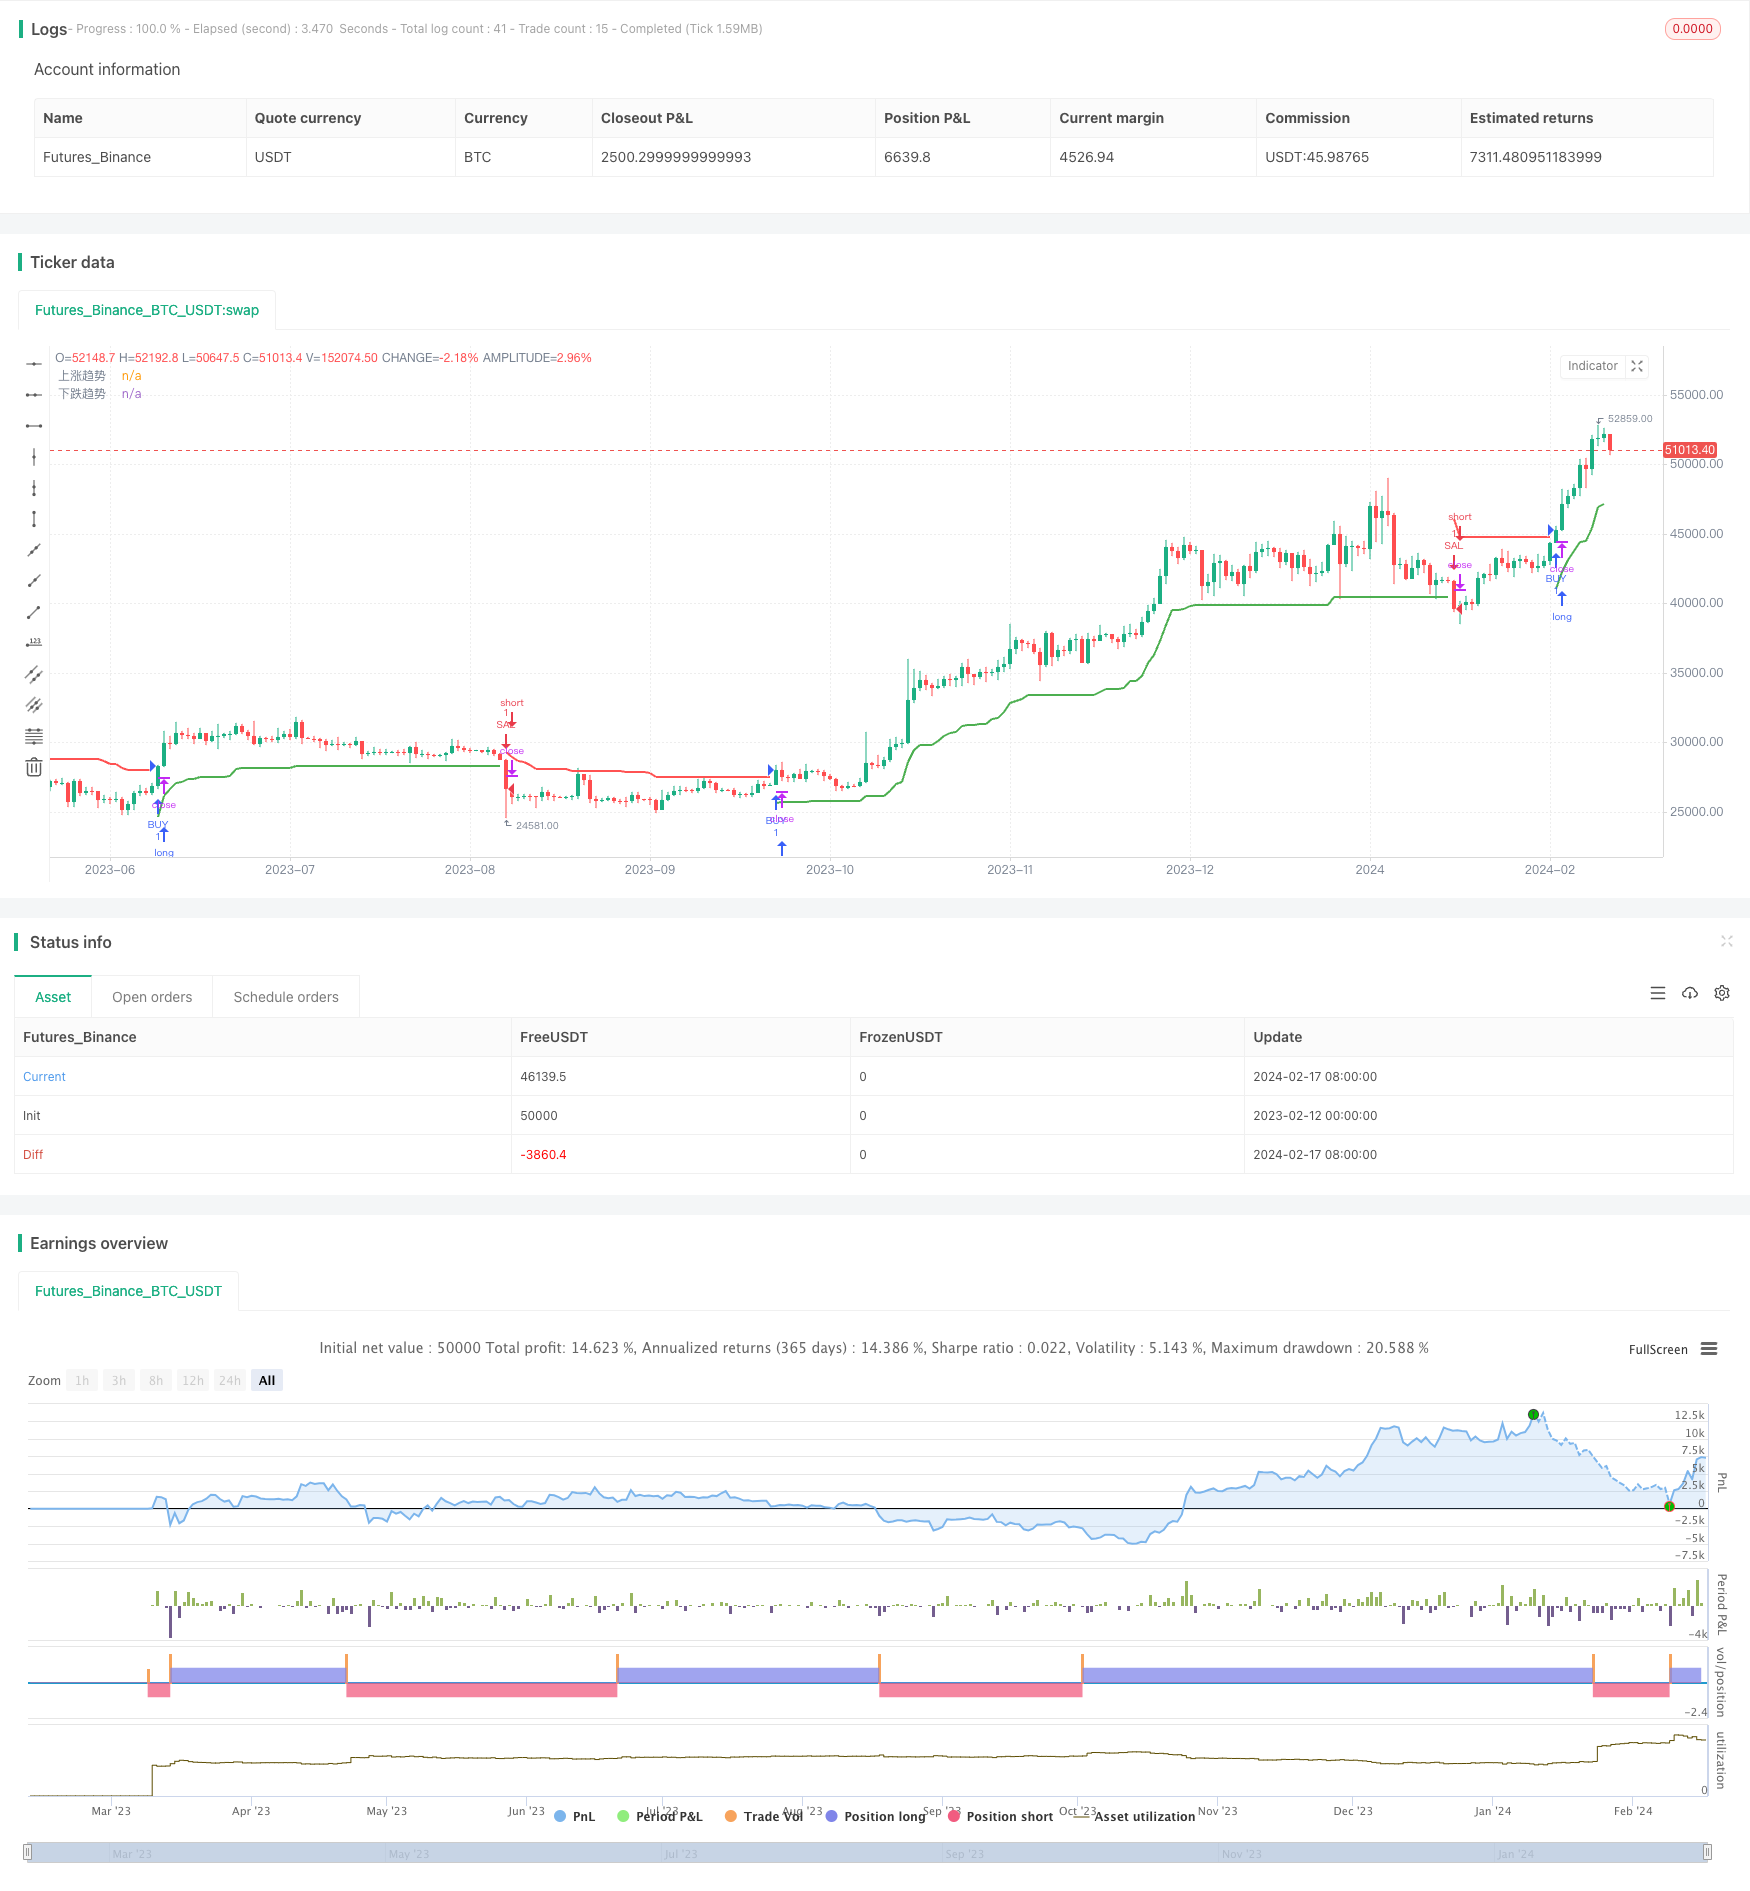
超级ATR趋势跟踪策略是一种基于ATR指标的趋势跟踪策略。它使用ATR指标来测量市场的波动性,并以ATR的若干倍作为止损线,实现趋势跟踪。
该策略首先计算ATR指标,其中ATR指标是过去N天内的股价波动幅度的移动平均,用来表示市场风险和波动性。策略允许我们更改ATR的计算方法,可以选择普通ATR或者SMA方式计算。
然后根据ATR值乘以一个倍数作为通道上下轨,即计算上轨:close - Multiplier * ATR;计算下轨:close + Multiplier * ATR。这构成了基于ATR指标的趋势通道。
进而我们判断当前价格是否突破通道上下轨。如果价格突破上轨,则判断为进入下降趋势;如果价格突破下轨,则判断为进入上涨趋势。在趋势突破时,我们 correspondingly 进行买入和卖出。
此外,策略还设定了交易时间窗口,只在指定的日期时间段内交易。
这种基于指标通道的趋势跟踪策略,具有以下几个优点:
- 使用ATR指标自动调整止损位置,能够有效控制风险
- ATR指标考虑了股价波动性,止损线更合理
- 采用通道突破判断入场,增加了入场精确度
- 允许调整ATR计算方式,增加了策略灵活性
- 设置交易时间窗口,避免重大事件的策略失效
总的来说,这是一个简单实用的趋势跟踪策略,能够有效控制风险,同时获得较好的收益。
该策略也存在一些风险,主要有:
- 市场出现剧烈变动时,ATR指标可能来不及反应市场变化,导致止损过于宽松
- 多空意见不一致时,价格可能在通道内震荡,增加交易风险
- 固定的倍数设置可能不适合全部品种,需要针对不同品种调整
- setWindow限制了交易机会,如果没设定好,可能错过较好交易机会
为了控制这些风险,我们可以采取以下措施:
- 结合其他指标判断市场状态,避免单一依赖ATR指标
- 增加过滤条件,避免无效突破引入交易风险
- 根据不同品种历史特征选择合适的倍数
- 优化和测试setWindow的参数,确保其设置合理
这种策略还有进一步优化的空间:
- 可以引入机器学习算法,实现倍数的动态优化
- 可以结合情绪指标等判断多空杠杆,优化通道范围
- 增加交易量或波动确认,避免无效突破
- 利用高级基于时间的策略框架进行Backtest
通过这些优化,可以进一步提高策略的稳定性和收益率。
本策略overall是一个非常实用的趋势跟踪策略。它使用ATR指标构建自适应通道,并以通道突破判断买卖时机。策略简单实用,能有效控制风险,适合跟踪中长线趋势。我们也提出了进一步的风险控制和策略优化建议,这将使该策略更加强大和稳健。
||
The Super ATR Trend Following Strategy is an ATR indicator based trend following strategy. It uses the ATR indicator to measure market volatility and sets stop loss based on multiple ATRs to track trends.
The strategy first calculates the ATR indicator, which is the moving average of the price volatility over the past N days, to represent market risk and volatility. The strategy allows us to change the ATR calculation method, either regular ATR or SMA.
Then the upper and lower bands are calculated based on ATR value multiplied by a factor, ie: close - Multiplier * ATR for upper band; close + Multiplier * ATR for lower band. This forms an ATR based trend channel.
We then judge if the current price breaks through the upper or lower band of the channel. If price breaks through the upper band, it is judged as entering a downtrend; if price breaks through the lower band, it is judged as entering an uptrend. When there is a trend breakout, we make the corresponding buy and sell.
In addition, the strategy has set a trading time window to only trade in the specified date time range.
This indicator channel based trend following strategy has the following advantages:
- Using ATR indicator to automatically adjust stop loss position effectively controls risks
- ATR considers price volatility, more reasonable stop loss
- Increase entry precision by channel breakout
- Allows adjustment of ATR calculation method, more flexible
- Setting trading window avoids strategy failure during significant events
In general, this is a simple and practical trend following strategy that can effectively control risks and obtain good returns.
There are also some risks to this strategy:
- Market may have violent changes that ATR fails to react timely, resulting in too loose stop loss
- Price may range in channel when sentiment diverges, increasing trading risk
- Fixed multiple may not suit all products, needs adjustment accordingly
- setWindow limits trading opportunities, may miss good trades if not set properly
To control these risks, we can take the following measures:
- Combine other indicators to determine market condition, avoid solely relying on ATR
- Add filters to avoid invalid breakout introducing trade risk
- Select proper multiplier according to historical characteristics of different products
- Optimize and test setWindow parameters to ensure proper setup
There is room for further optimization of this strategy:
- Introduce machine learning algorithms to dynamically optimize multiplier
- Incorporate sentiment indicators etc to optimize channel range
- Add volume or volatility confirmation to avoid invalid breakout
- Utilize advanced time based strategy framework for backtest
These optimizations can further improve the stability and profitability of the strategy.
Overall this is a very practical trend following strategy. It builds an adaptive channel using ATR indicator and determines entries by channel breakouts. The strategy is simple and effective to control risks, suitable for tracking mid-long term trends. We also proposed further risk control and optimization suggestions to make the strategy more robust.
[/trans]
Strategy Arguments
| Argument | Default | Description |
|---|---|---|
| v_input_1 | 10 | ATR周期 |
| v_input_2_hl2 | 0 | 价格数据源: hl2 |
| v_input_float_1 | 3 | ATR 乘数 |
| v_input_3 | true | 更改ATR计算方法 |
| v_input_4 | false | 显示买入/卖出信号 |
| v_input_int_1 | 9 | From Month |
| v_input_int_2 | true | From Day |
| v_input_int_3 | 2018 | From Year |
| v_input_int_4 | true | To Month |
| v_input_int_5 | true | To Day |
| v_input_int_6 | 9999 | To Year |
Source (PineScript)
/*backtest
start: 2023-02-12 00:00:00
end: 2024-02-18 00:00:00
period: 1d
basePeriod: 1h
exchanges: [{"eid":"Futures_Binance","currency":"BTC_USDT"}]
*/

//@version=5
strategy('B厂长 @超级趋势精简优化版', overlay=true)
Periods = input(title='ATR周期', defval=10)
src = input(hl2, title='价格数据源')
Multiplier = input.float(title='ATR 乘数', step=0.1, defval=3.0)
changeATR = input(title='更改ATR计算方法', defval=true,tooltip = '默认为art否则sma(ta.tr,ATR周期)')
showsignals = input(title='显示买入/卖出信号', defval=false)
atr2 = ta.sma(ta.tr, Periods)
atr = changeATR ? ta.atr(Periods) : atr2
up = src - Multiplier * atr
up1 = nz(up[1], up)
up := close[1] > up1 ? math.max(up, up1) : up
dn = src + Multiplier * atr
dn1 = nz(dn[1], dn)
dn := close[1] < dn1 ? math.min(dn, dn1) : dn
trend = 1
trend := nz(trend[1], trend)
trend := trend == -1 and close > dn1 ? 1 : trend == 1 and close < up1 ? -1 : trend
upPlot = plot(trend == 1 ? up : na, title='上涨趋势', style=plot.style_linebr, linewidth=2, color=color.new(color.green, 0))
buySignal = trend == 1 and trend[1] == -1
plotshape(buySignal and showsignals ? up : na, title='买点', text='买点', location=location.absolute, style=shape.labelup, size=size.tiny, color=color.new(color.green, 0), textcolor=color.new(color.white, 0))
dnPlot = plot(trend == 1 ? na : dn, title='下跌趋势', style=plot.style_linebr, linewidth=2, color=color.new(color.red, 0))
sellSignal = trend == -1 and trend[1] == 1
plotshape(sellSignal and showsignals ? dn : na, title='卖点', text='卖点', location=location.absolute, style=shape.labeldown, size=size.tiny, color=color.new(color.red, 0), textcolor=color.new(color.white, 0))
FromMonth = input.int(defval=9, title='From Month', minval=1, maxval=12)
FromDay = input.int(defval=1, title='From Day', minval=1, maxval=31)
FromYear = input.int(defval=2018, title='From Year', minval=999)
ToMonth = input.int(defval=1, title='To Month', minval=1, maxval=12)
ToDay = input.int(defval=1, title='To Day', minval=1, maxval=31)
ToYear = input.int(defval=9999, title='To Year', minval=999)
start = timestamp(FromYear, FromMonth, FromDay, 00, 00)
finish = timestamp(ToYear, ToMonth, ToDay, 23, 59)
window() =>
    time >= start and time <= finish ? true : false
longCondition = buySignal
if longCondition and window()
    strategy.entry('BUY', strategy.long, comment = '做多')
shortCondition = sellSignal
if shortCondition and window()
    strategy.entry('SAL', strategy.short, comment = '做空')

buy1 = ta.barssince(buySignal)
sell1 = ta.barssince(sellSignal)
color1 = buy1[1] < sell1[1] ? color.green : buy1[1] > sell1[1] ? color.red : na
Detail
https://www.fmz.com/strategy/442096
Last Modified
2024-02-19 11:41:20
