Name
自适应通道突破策略Adaptive-Channel-Breakout-Strategy
Author
ChaoZhang
Strategy Description
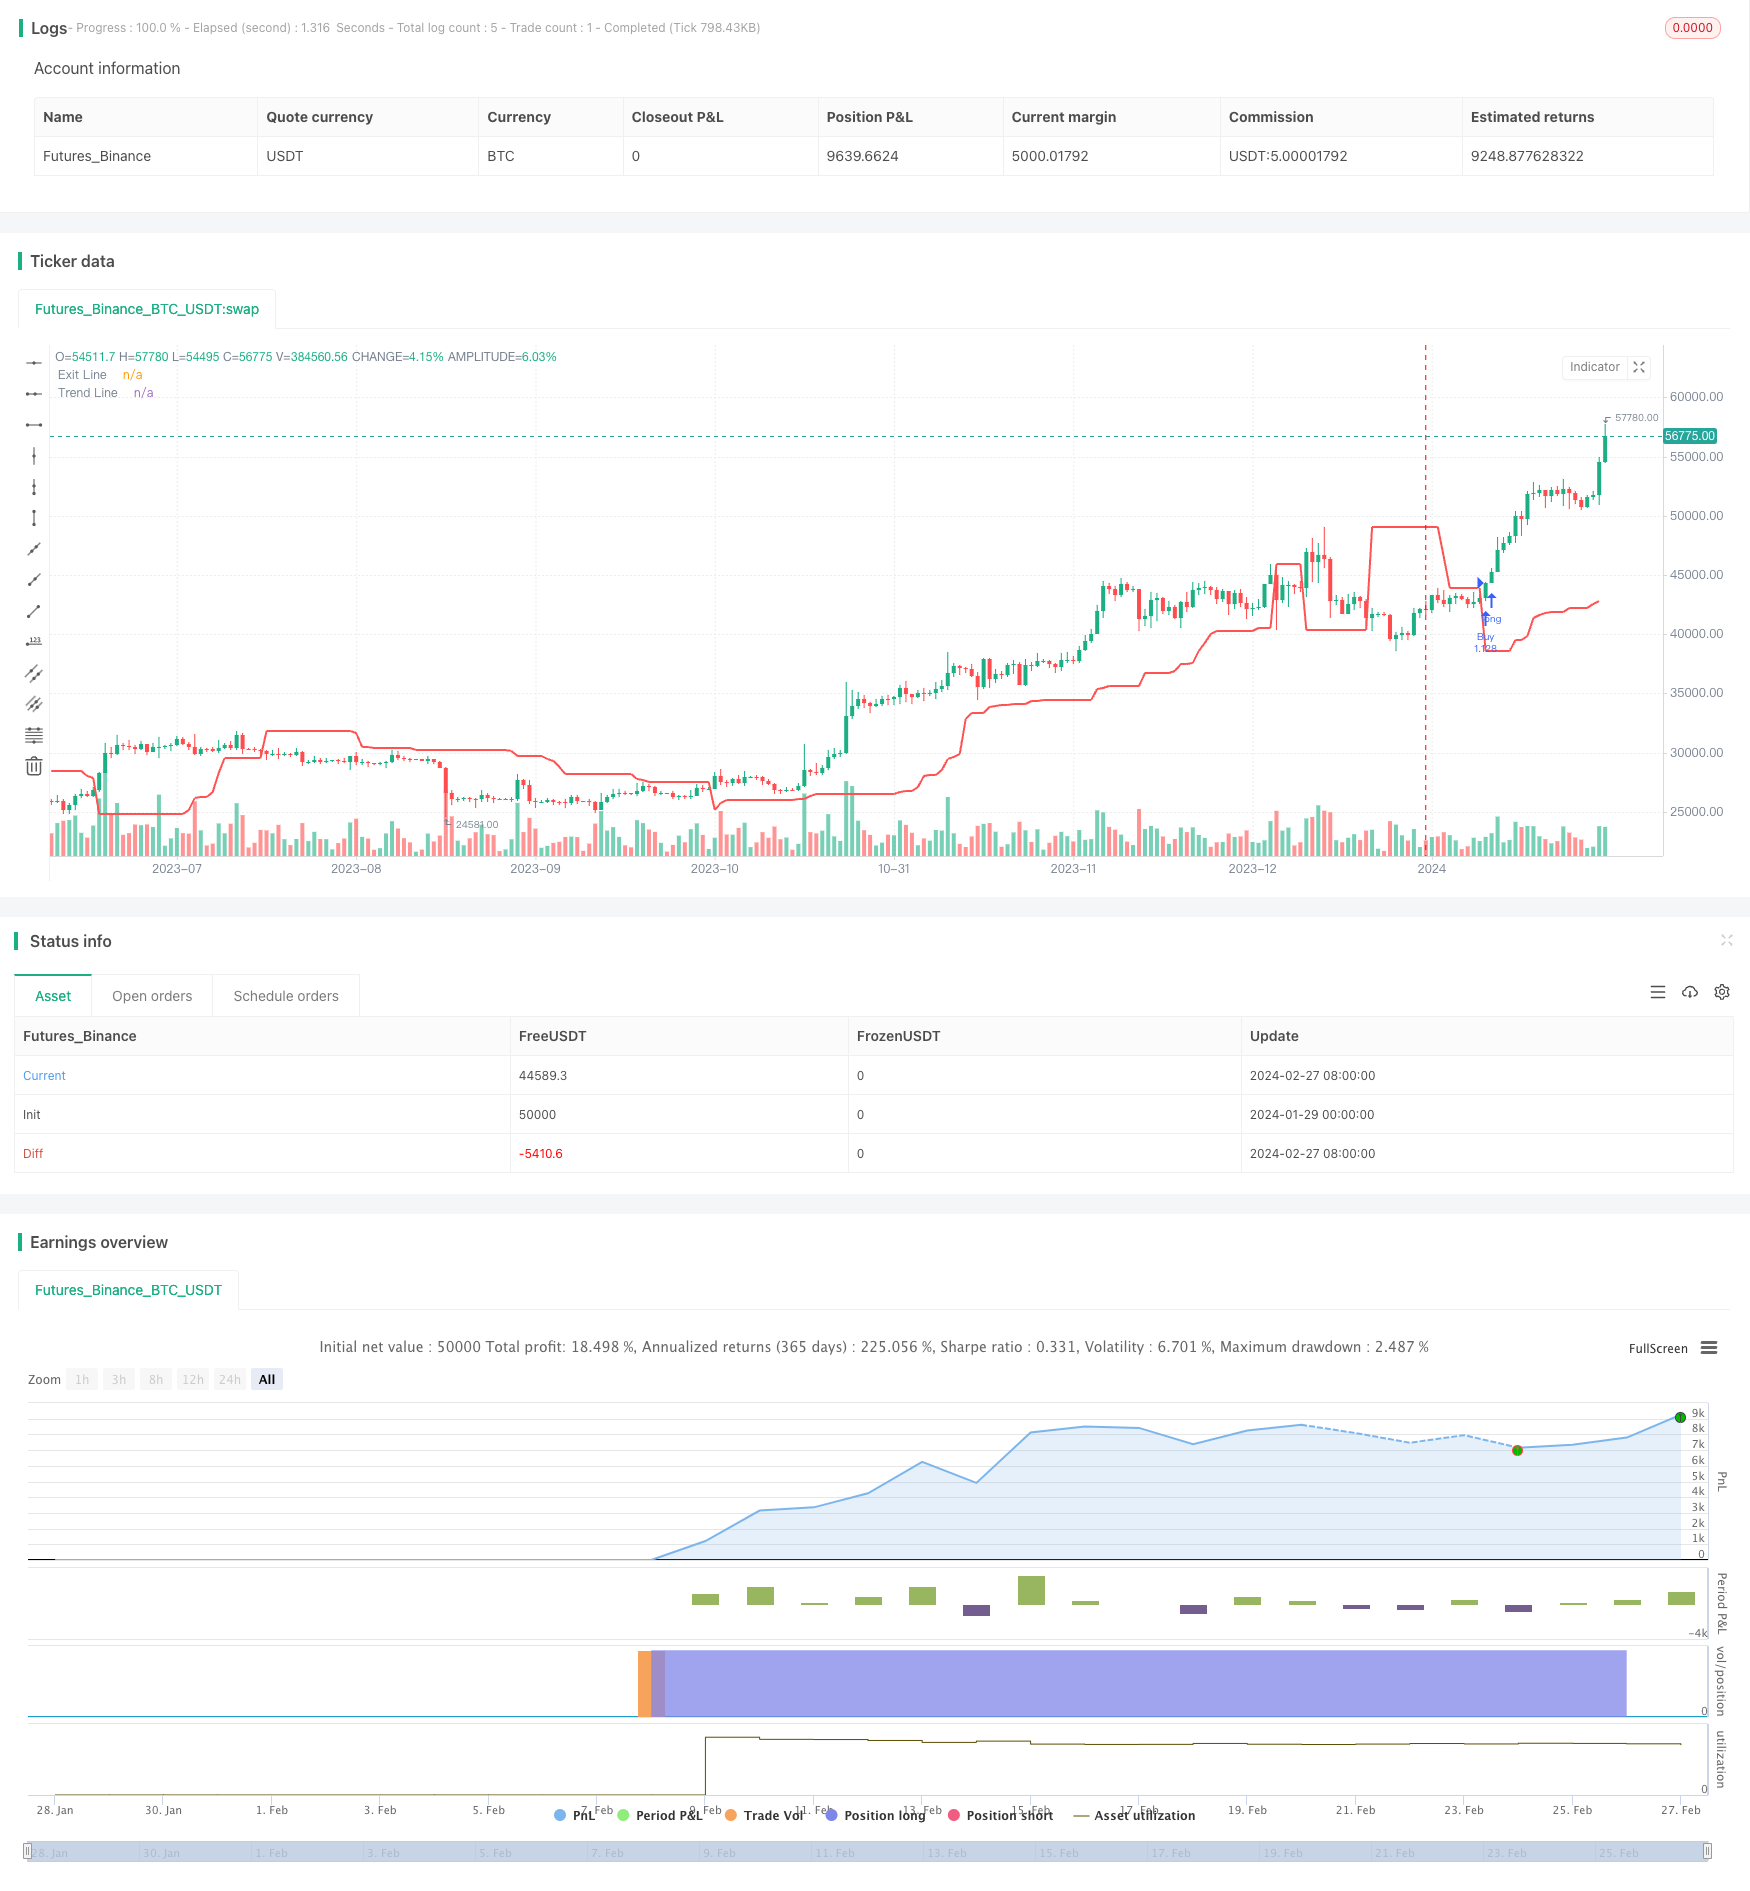
自适应通道突破策略(Adaptive Channel Breakout Strategy)是一种追踪市场价格通道的趋势策略。它通过计算指定周期的最高价和最低价来确定价格通道,并在价格突破通道时发出交易信号。
该策略的优点是可以自动适应市场变化,通过扩大通道来过滤噪音,在趋势明确时产生交易信号。但是也存在追高杀跌的风险。通过优化参数可以减少不必要的交易,提高盈利率。
该策略基于通道突破理论。它同时计算两组不同周期(入市长度和出市长度)的最高价和最低价,形成通道。当价格超过通道时就产生信号。
具体来说,策略先计算20周期(入市长度)的最高价upper和最低价lower,形成价格通道。然后它再计算10周期(出市长度)的最高价sup和最低价sdown。在买入信号触发(价格超过上轨)后,以10周期的最低价sdown为止损线。在卖出信号触发(价格跌破下轨)后,以10周期的最高价sup为止盈线。这样就形成了一个自适应的通道。
当价格突破通道时,表明趋势正在形成,这时策略会发出交易信号。同时,止盈止损线也会随价格变化进行调整,从而锁定利润,避免损失。
- 自动适应市场变化。该策略的通道会根据最近价格自动调整,在趋势开始时 Expanding了通道范围来过滤噪音。
- 强势断裂交易。仅在价格高位突破上轨或低位跌破下轨时才入场,避免追高杀跌。
- 风险控制机制。采用不同周期计算的止盈止损线,可以灵活锁定利润,避免损失扩大。
- 策略简单易实现。仅需两个参数,testdata容易取得,适合量化交易。
该策略主要存在以下风险:
- 追高杀跌风险。当通道范围过大时,存在追高买入和杀跌卖出的风险。可以通过优化参数减少不必要交易。
- 止损风险。固定周期的止损线可能过于死板,可以考虑采用自适应ATR止损。
- 交易频率过高风险。参数设置不当可能导致交易次数过于频繁。可以考虑加入过滤条件以控制交易频率。
- 市场异常风险。该策略基于历史数据判断未来趋势,当市场发生重大变化时可能失效或亏损。
该策略还存在以下优化空间:
- 结合趋势指标过滤信号。可以引入EMA或MACD等趋势指标,只在趋势方向与通道突破方向一致时才入场。
- 引入自适应ATR止损。使用平均真实波幅计算的自适应止损线,可以更好控制单笔损失。
- 优化参数组合。可以通过更多组合测试找出参数优化组合,进一步提高策略盈利率。
- 结合机器学习技术。使用神经网络或遗传算法生成动态参数,使策略更具鲁棒性。
自适应通道突破策略整体思路清晰,具有较强的可行性。它能够自动跟踪市场变化,在趋势形成时产生交易信号。同时设置两套周期的通道和止盈止损机制控制风险。该策略可以通过参数优化、引入过滤条件等方式进一步提升稳定性和盈利能力。值得进一步实盘验证和优化改进。
||
The Adaptive Channel Breakout Strategy is a trend-following strategy that tracks the price channels of the market. It determines the price channels by calculating the highest and lowest prices over a specified period and generates trading signals when prices break out of the channels.
The advantage of this strategy is that it can automatically adapt to market changes by expanding the channels to filter out noise and produce trading signals when a trend is clear. However, there are also risks of chasing high prices and killing low prices. Optimizing parameters can reduce unnecessary trades and improve profitability.
This strategy is based on the channel breakout theory. It calculates two sets of highest and lowest prices over different periods (entry length and exit length) to form channels. When prices exceed the channels, signals are generated.
Specifically, the strategy first calculates the 20-period highest price (upper) and lowest price (lower) to form the price channel. It then calculates the 10-period highest price (sup) and lowest price (sdown). After a buy signal is triggered (price breaks above upper rail), the 10-period lowest price (sdown) is used as the stop loss line. After a sell signal is triggered (price breaks below lower rail), the 10-period highest price (sup) is used as the take profit line. This forms an adaptive channel system.
When prices break through the channel, it indicates that a trend is forming. The strategy will then emit trading signals. At the same time, the take profit and stop loss lines will also adjust with price changes to lock in profits and avoid losses.
- Automatically adapts to market changes. The channel of this strategy adjusts automatically based on recent prices, Expanding the channel range to filter out noise when a trend starts.
- Trades on strong breakouts. Only enters on upside breakouts or downside breakouts, avoiding chasing high prices and killing low prices.
- Risk control mechanisms. Adopts stop loss and take profit lines based on different periods to flexibly lock in profits and prevent enlarged losses.
- Easy to implement. Only requires two parameters and testdata is easy to obtain, suitable for quantitative trading.
The main risks of this strategy include:
- Chasing high and killing low risk. There is risk of buying high and selling low when the channel range is too large. This can be mitigated by optimizing parameters to reduce unnecessary trades.
- Stop loss risk. Fixed-period stop loss lines may be too rigid. Adaptive ATR stop loss can be considered.
- High trading frequency risk. Improper parameter settings may lead to excessively frequent trading. Filter conditions can be added to control trade frequency.
- Market anomaly risk. This strategy judges future trends based on historical data and may fail or lose money when drastic market changes occur.
The potential optimizations of this strategy include:
- Add trend indicator filters. Trend indicators like EMA or MACD can be introduced to only take signals when they align with the channel breakout direction.
- Introduce adaptive ATR stop loss. Stop loss lines calculated from average true range can better control single trade loss.
- Optimize parameter combinations. Further improve strategy profitability by finding optimized parameter combinations through more backtests.
- Introduce machine learning techniques. Use neural networks or genetic algorithms to generate dynamic parameters for improved robustness.
The Adaptive Channel Breakout Strategy has clear logic and strong feasibility overall. It can automatically track market changes and generate trading signals when trends form. The dual-channel and stop loss/take profit mechanisms also help control risks. This strategy can be further enhanced in stability and profitability through parameter optimization, filtering conditions, etc. It is worth further live trading verification and refinement.
[/trans]
Strategy Arguments
| Argument | Default | Description |
|---|---|---|
| v_input_1 | 20 | Entry Length |
| v_input_2 | 10 | Exit Length |
Source (PineScript)
/*backtest
start: 2024-01-29 00:00:00
end: 2024-02-28 00:00:00
period: 1d
basePeriod: 1h
exchanges: [{"eid":"Futures_Binance","currency":"BTC_USDT"}]
*/

//@version=4
strategy("Turtle Trade Channels Strategy", shorttitle="TTCS", overlay=true, default_qty_type=strategy.percent_of_equity, default_qty_value=100)

length = input(20,"Entry Length", minval=1)
len2=input(10, "Exit Length", minval=1)

lower = lowest(length)
upper = highest(length)

up=highest(high,length)
down=lowest(low,length)
sup=highest(high,len2)
sdown=lowest(low,len2)
K1=barssince(high>=up[1])<=barssince(low<=down[1]) ? down : up
K2=iff(barssince(high>=up[1])<=barssince(low<=down[1]),sdown,sup)
K3=iff(close>K1,down,na)
K4=iff(close<K1,up,na)

buySignal=high==upper[1] or crossover(high,upper[1])
sellSignal = low==lower[1] or crossover(lower[1],low)
buyExit=low==sdown[1] or crossover(sdown[1],low)
sellExit = high==sup[1] or crossover(high,sup[1])

strategy.entry("Buy", strategy.long, when = buySignal and barssince(buySignal) < barssince(sellSignal[1]))
strategy.entry("Sell", strategy.short, when = sellSignal and barssince(sellSignal) < barssince(buySignal[1]))
strategy.exit("Buy Exit", from_entry = "Buy", when = buyExit and barssince(buyExit) < barssince(sellExit[1]))
strategy.exit("Sell Exit", from_entry = "Sell", when = sellExit and barssince(sellExit) < barssince(buyExit[1]))

plot(K1, title="Trend Line", color=color.red, linewidth=2)
e=plot(K2, title="Exit Line", color=color.blue, linewidth=1, style=6)
Detail
https://www.fmz.com/strategy/443136
Last Modified
2024-02-29 14:49:05
