Name
突破高低点回测策略Breakthrough-Highs-and-Lows-Backtesting-Strategy
Author
ChaoZhang
Strategy Description
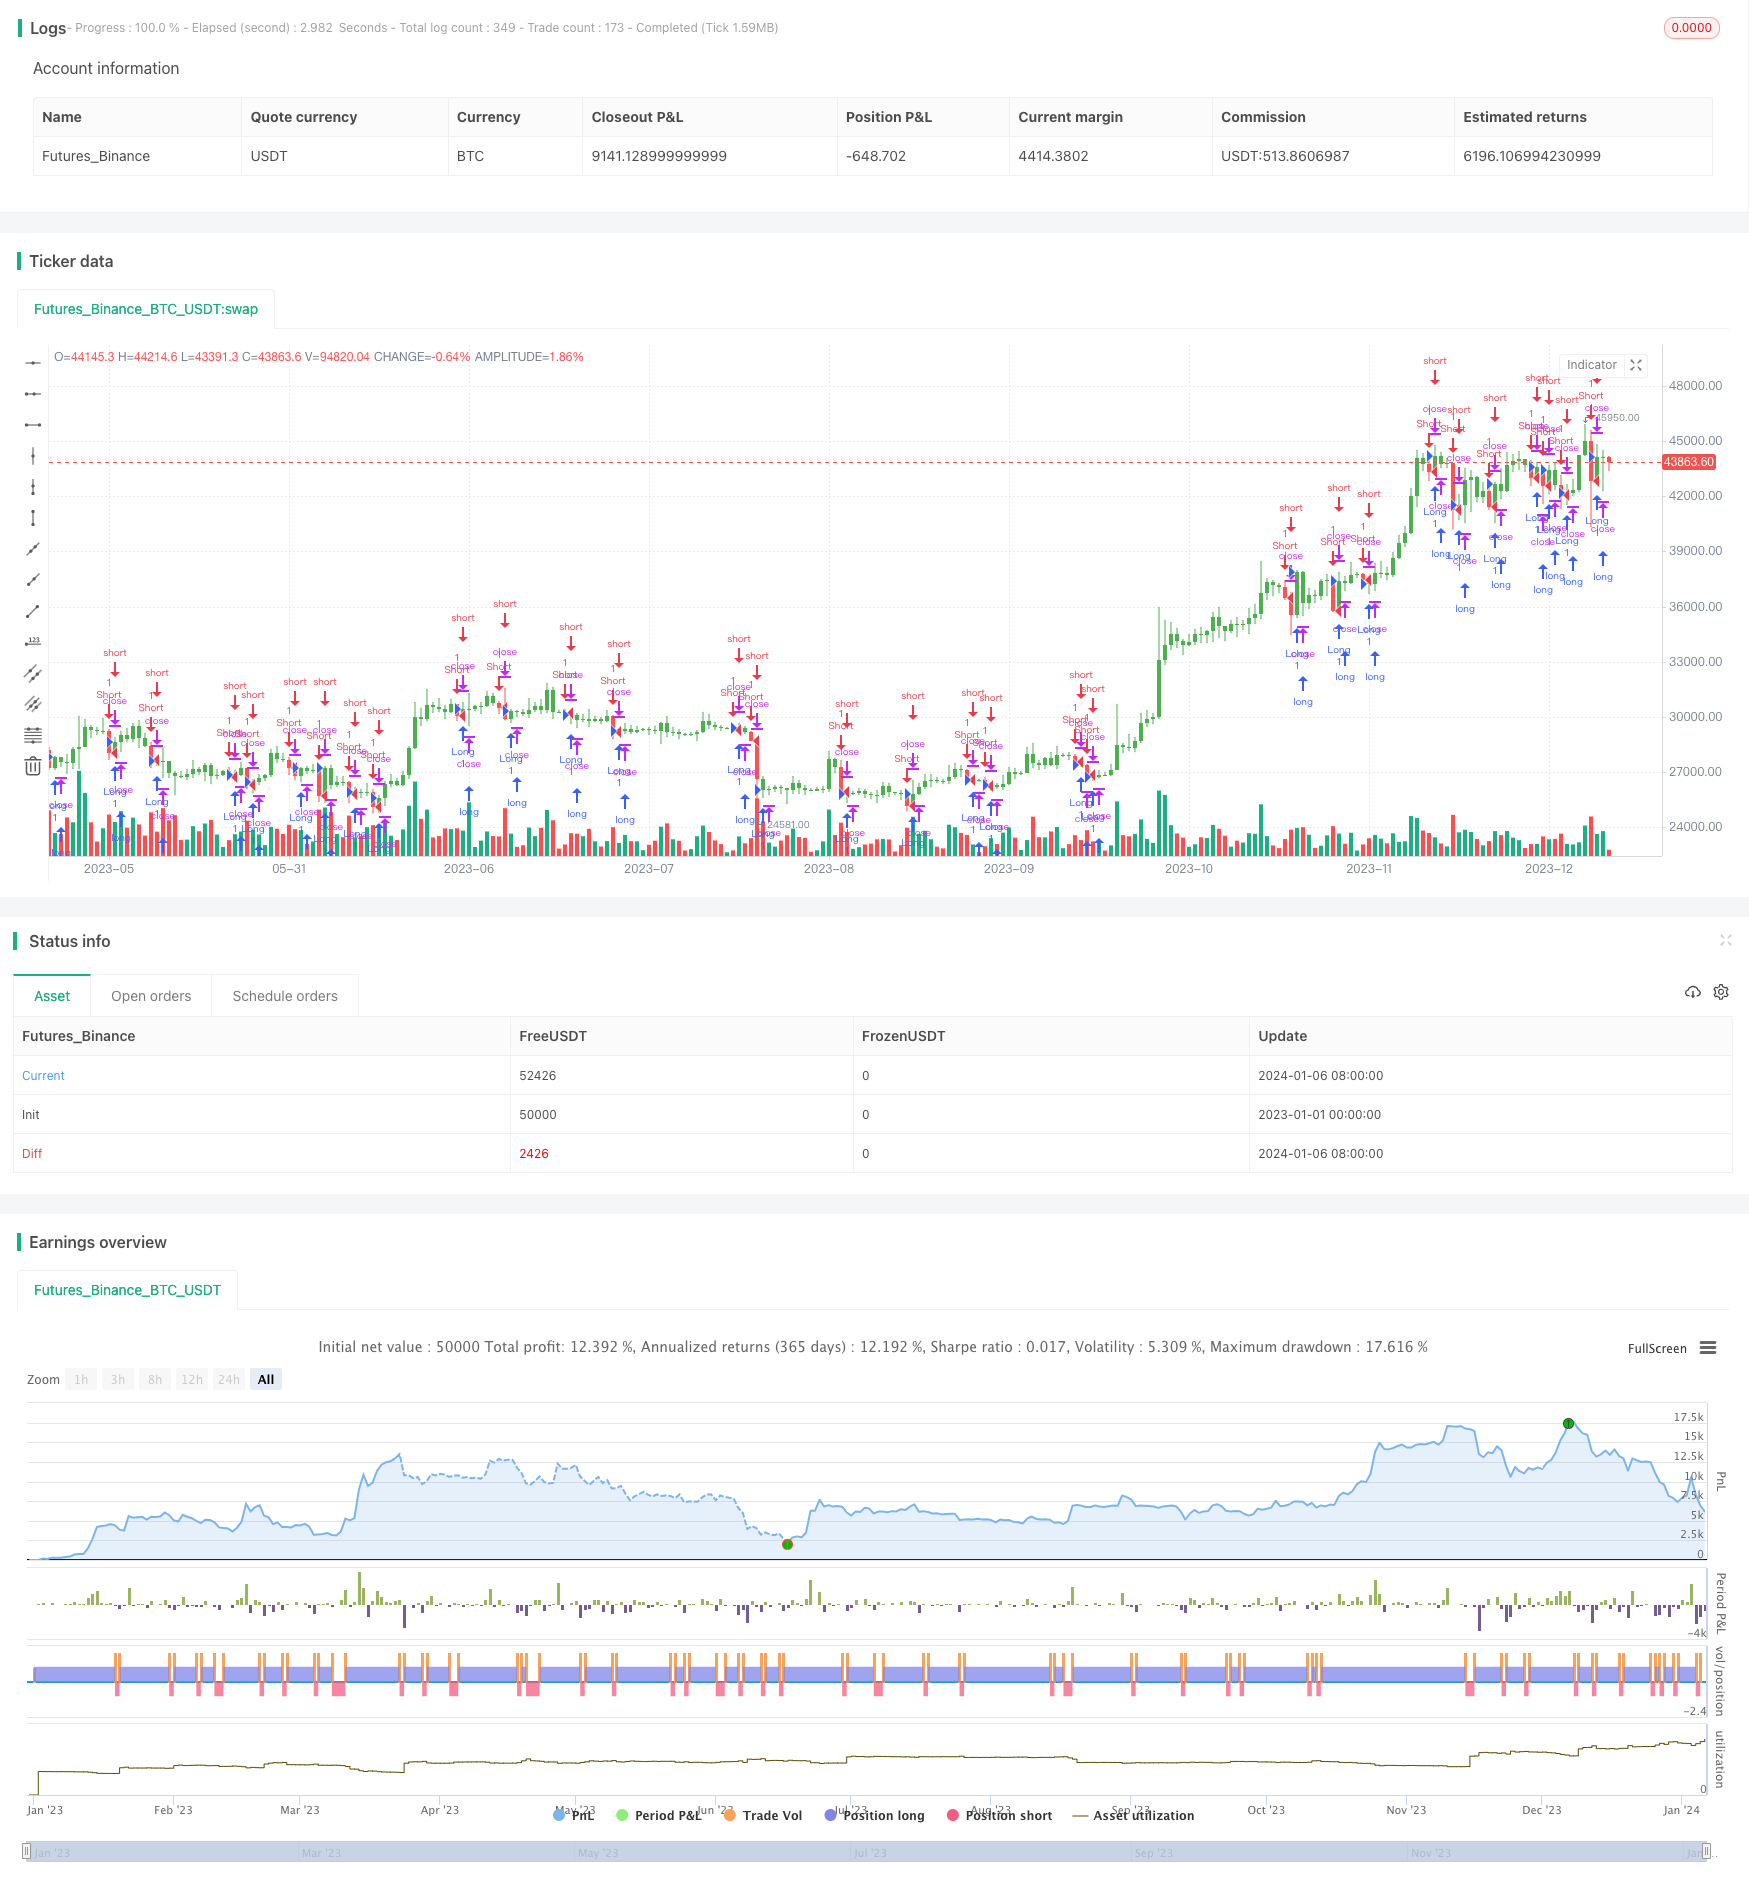
该策略基于突破周期高低点来判断趋势方向,在价格突破周期高点时做多,突破周期低点时做空,属于趋势跟踪策略。
该策略首先读取用户设置的周期(日线、周线等)和回看周期数。然后根据这些参数得到回看周期的最高价和最低价。例如设置为日线周期、回看1周期,则取上一日的最高价和最低价。
在实际交易中,如果收盘价大于等于回看周期的最低价,则判断为向上突破,做多;如果收盘价小于等于回看周期的最高价,则判断为向下突破,做空。
这样通过突破周期高低点来捕捉趋势方向,属于趋势跟踪策略的一种。
该策略主要有以下几点优势:
-
基于突破点判断趋势方向,容易抓住强势盘整后的大趋势。
-
操作简单容易理解,非常适合新手学习使用。
-
可方便优化调整周期参数,适用于不同品种。
-
可通过反向输入设置逆向操作,丰富策略运用。
-
绘制周期高低点辅助判断,形成多重验证。
该策略也存在一些风险:
-
无法有效过滤震荡盘整,可能出现多次误操作。
-
无法控制止损,存在一定程度上的亏损风险。
-
对交易费用敏感,实际盈亏存在一定偏差。
-
无法限制仓位规模,存在超量问题。
针对上述风险,可设置止损机制、优化过滤条件、控制仓位数量等方法进行优化。
该策略主要可从以下几个方向进行优化:
-
增加过滤机制,避免震荡盘整频繁开仓。可设置价格通道、波动率等过滤条件。
-
设置移动止损或时间止损。控制单笔损失风险,确保整体profitability。
-
优化仓位规模和资金管理,防止超量问题,确保策略稳定性。
-
测试不同周期参数的效果,选择最优参数组合。
-
增加算法交易模块,利用机器学习算法提高决策效率。
总的来说,该突破高低点回测策略基于趋势跟踪判断方向,简单易操作,适合新手学习,但存在被套利困难的风险。通过增加过滤条件、止损机制、控制仓位等优化手段,可以减轻这些风险,使策略效果更好。该策略可为我们进一步研究和改进提供思路和借鉴作用。
||
This strategy judges trend direction based on breaking through periodic highs and lows. It goes long when price breaks through the periodic high and goes short when price breaks below the periodic low. It belongs to the trend tracking strategy.
The strategy first reads the user-defined cycle (daily, weekly, etc.) and lookback periods. Then it gets the highest and lowest prices for the lookback period based on these parameters. For example, if it is set to daily cycle and lookback 1 period, it takes the highest and lowest prices for the previous day.
In actual trading, if the closing price is greater than or equal to the lowest price of the lookback period, it is judged as an upward breakthrough and it goes long. If the closing price is less than or equal to the highest price of the lookback period, it is judged as a downward breakthrough and it goes short.
By capturing the trend direction through breaking through periodic highs and lows, this strategy belongs to a kind of trend tracking strategy.
The main advantages of this strategy are:
-
Capturing the big trend after strong consolidation by judging direction based on breakthrough points.
-
Simple and easy to understand, very suitable for beginners to learn and use.
-
Easy to optimize by adjusting periodic parameters, applicable to different varieties.
-
Can set reverse input for reverse operation, enriching strategy use.
-
Drawing periodic highs and lows to assist judgement and form multi-validation.
There are also some risks:
-
Cannot effectively filter sideways volatility, possible multiple mis-operations.
-
Cannot control stop loss, certain degree of loss risk exists.
-
Sensitive to trading costs, actual PnL may deviate.
-
Cannot limit position size, over-trading risk exists.
To address these risks, methods like setting stop loss, optimizing filter conditions, controlling position size can be used.
The main optimization directions are:
-
Adding filter mechanisms to avoid frequent opening during sideways. Set price channel, volatility filters etc.
-
Set trailing stop loss or time stop loss to control single loss risk and ensure overall profitability.
-
Optimize position sizing and money management to prevent over-trading and ensure stability.
-
Test effects of different periodic parameters and select optimal parameter combinations.
-
Increase algorithmic trading modules, use machine learning algorithms to improve decision efficiency.
In summary, this breakthrough high low backtest strategy is simple to operate based on trend tracking, suitable for beginners to learn, but risks being trapped exist. By adding optimizations like filters, stops, position control, these risks can be reduced and strategy results improved. It can provide ideas and references for our further research and improvements.
[/trans]
Strategy Arguments
| Argument | Default | Description |
|---|---|---|
| v_input_1 | D | SelectPeriod |
| v_input_2 | true | LookBack |
| v_input_3 | false | Trade reverse |
Source (PineScript)
/*backtest
start: 2023-01-01 00:00:00
end: 2024-01-07 00:00:00
period: 1d
basePeriod: 1h
exchanges: [{"eid":"Futures_Binance","currency":"BTC_USDT"}]
*/

//@version=2
////////////////////////////////////////////////////////////
//  Copyright by HPotter v1.0 03/07/2018
// This script shows a high and low period value.
//    Width - width of lines
//    SelectPeriod - Day or Week or Month and etc.
//    LookBack - Shift levels 0 - current period, 1 - previous and etc.
//
// You can change long to short in the Input Settings
// WARNING:
// - For purpose educate only
// - This script to change bars colors.
////////////////////////////////////////////////////////////
strategy(title="High and Low Levels Backtest", shorttitle="HL Levels", overlay = true)
SelectPeriod = input("D", defval="D")
LookBack = input(1,  minval=0)
reverse = input(false, title="Trade reverse")
xHigh  = request.security(syminfo.tickerid, SelectPeriod, high[LookBack])
xLow   = request.security(syminfo.tickerid, SelectPeriod, low[LookBack])
vS1 = xHigh
vR1 = xLow
pos = iff(close > vR1, 1,
       iff(close < vS1, -1, nz(pos[1], 0)))
possig = iff(reverse and pos == 1, -1,
          iff(reverse and pos == -1, 1, pos))
if (possig == 1)
    strategy.entry("Long", strategy.long)
if (possig == -1)
    strategy.entry("Short", strategy.short)
barcolor(possig == -1 ? red: possig == 1 ? green : blue )
Detail
https://www.fmz.com/strategy/438051
Last Modified
2024-01-08 16:13:44
