Name
移动平均和随机指标交易策略-Moving-Average-and-Stochastic-Trading-Strategy
Author
ChaoZhang
Strategy Description
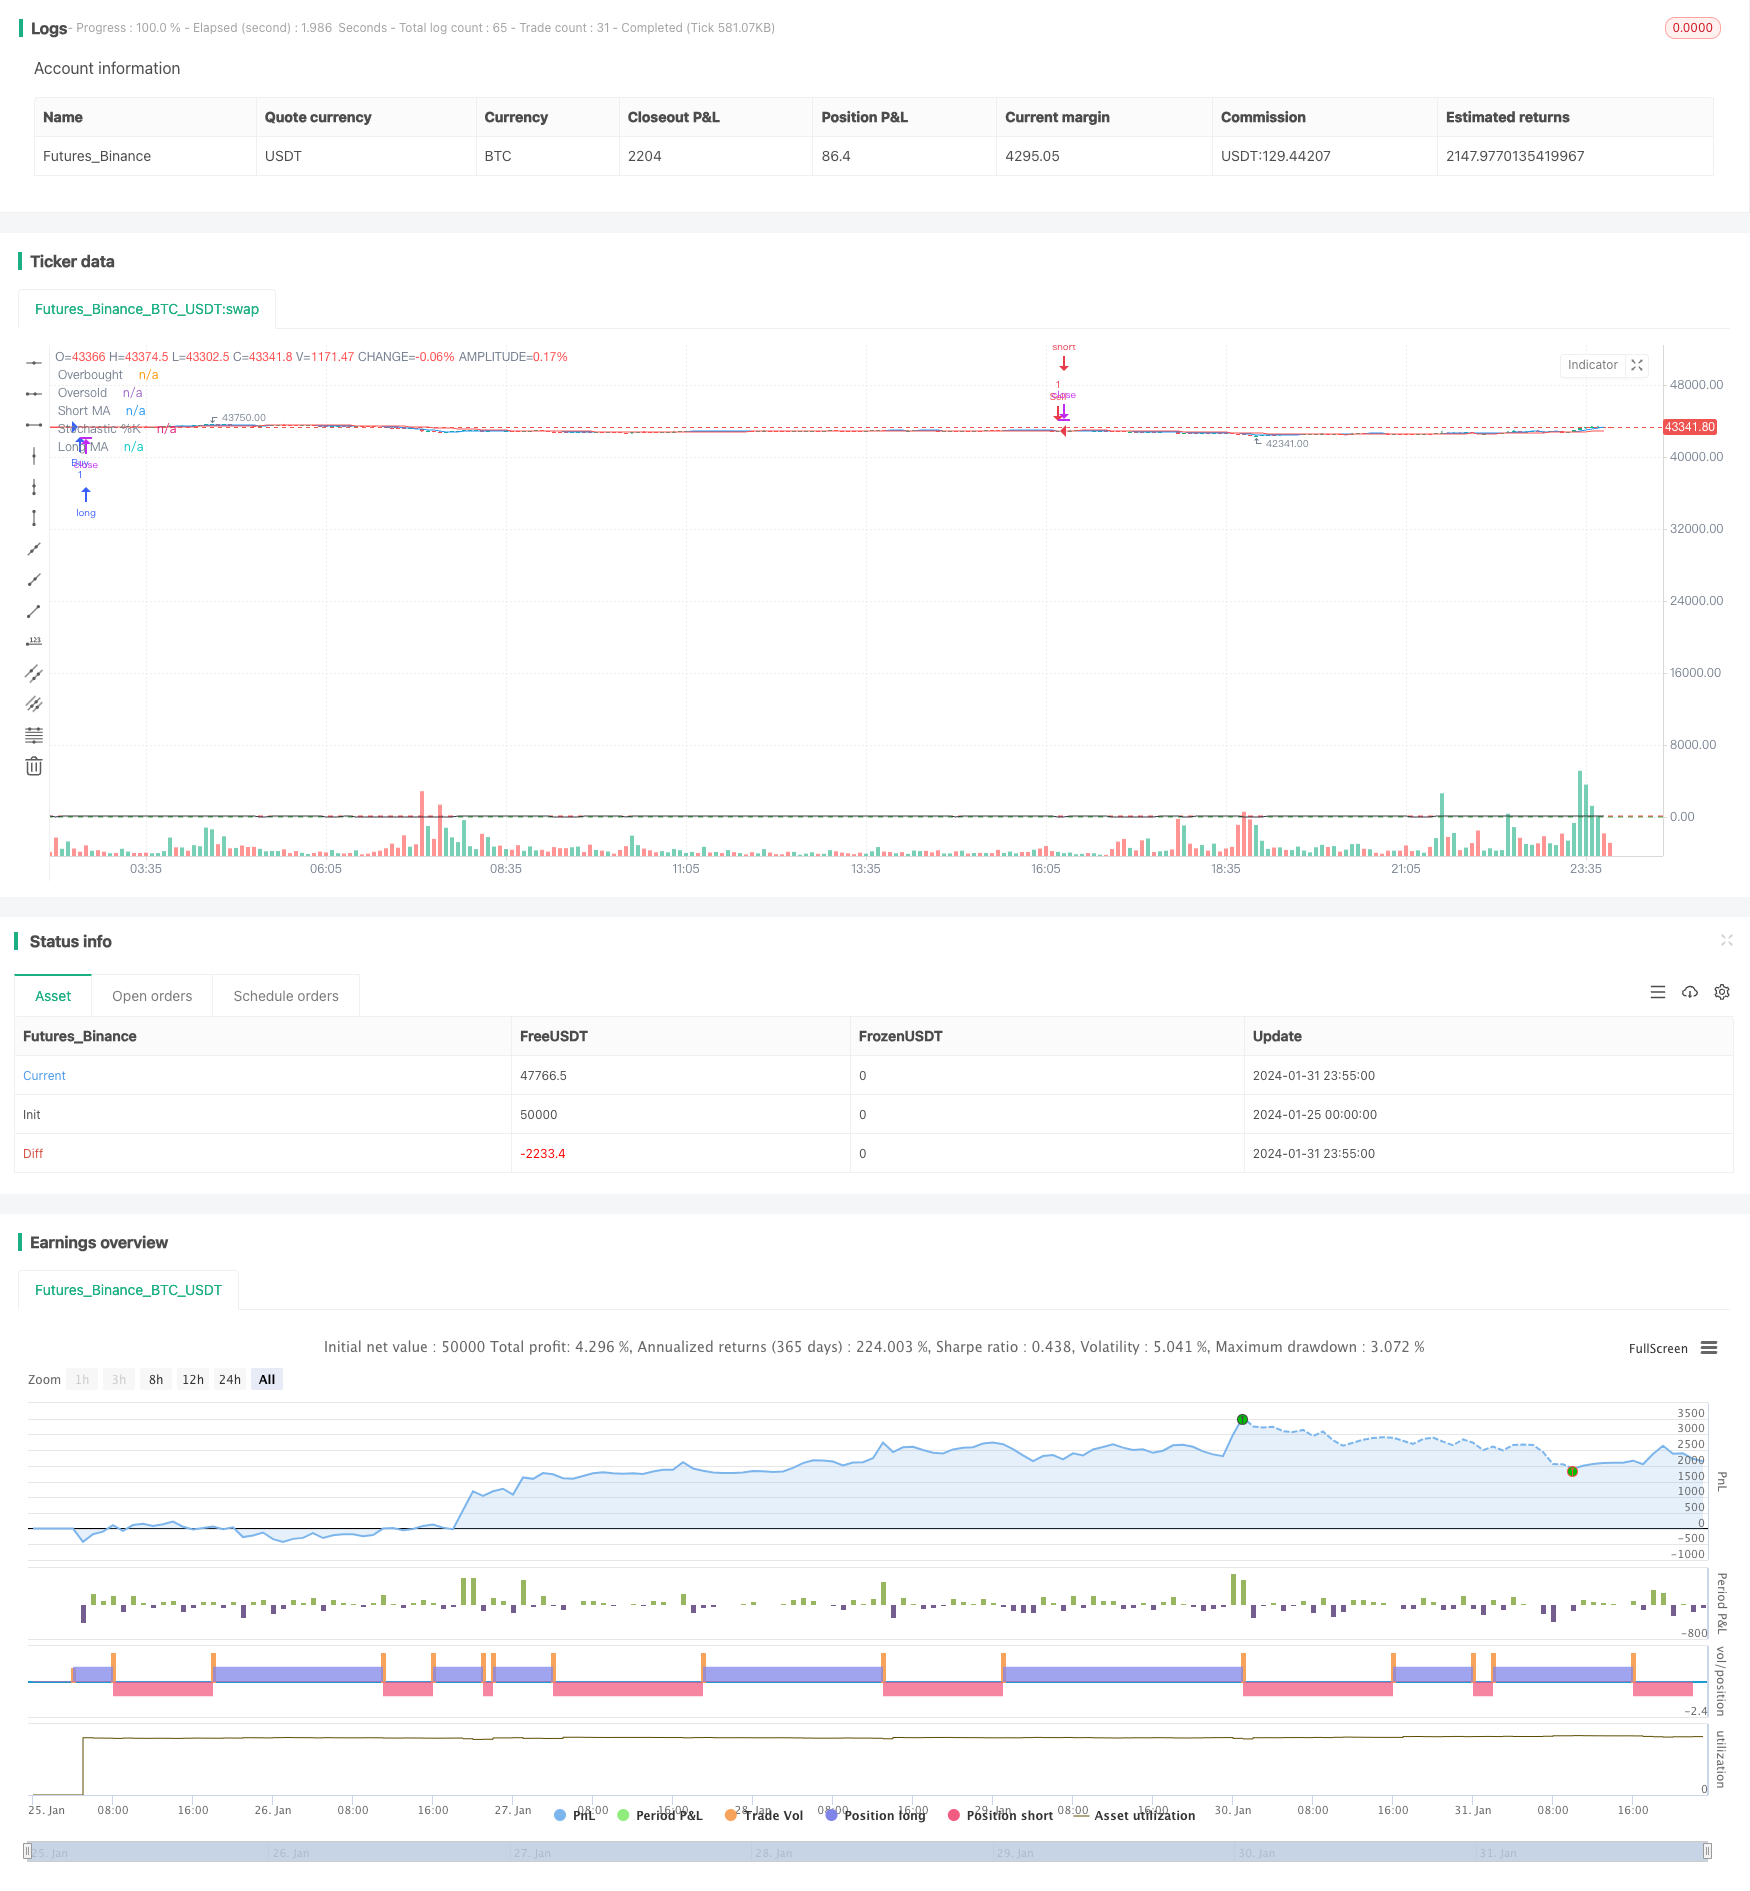
本策略结合移动平均线和随机指标,实现了一套自动化的股票交易系统。它使用两个不同长度的移动平均线以及随机指标来捕捉趋势和超买超卖的信号,根据趋势方向和超买超卖区域的指标信号来进行买卖操作。
使用快线(5日线)和慢线(20日线)两个移动平均线。当快线上穿慢线时为买入信号,下穿为卖出信号。移动平均线的作用是判断价格趋势和方向。
随机指标的参数设置为:K线周期14,K线平滑周期3,D线平滑周期3。K线在20以下为超卖区域,80以上为超买区域。随机指标的作用是判断是否处于超买超卖区域。
买入条件:快线上穿慢线 and K线<20(超卖区域) 卖出条件:快线下穿慢线 and K线>80(超买区域)
当满足买入条件时买入做多;满足卖出条件时卖出做空。
买入后设置1%的止盈;卖出后设置1%的止损。
这套策略结合趋势和指标,能够有效捕捉价格的中长线趋势,同时使用随机指标来控制买卖的时机,避免在没有明确方向性时随意的买卖操作。策略参数可调节空间大,可以针对不同市场环境进行调优。整体来说,这套策略对大中盘整体上涨的股票适用效果很好。
-
如果遇到特大消息面导致的剧烈行情,将可能带来较大亏损。可设置止损线来控制风险。
-
如果遇到持续横盘整理的市场,将可能带来连续小亏损。可适当调整移动平均线周期参数来减少损失。
-
需要注意避开股市关键时段,因为价格容易出现反转造成错误交易。
-
可以测试不同参数组合,寻找最佳参数组合。如测试不同长度的移动平均线组合效果。
-
可以结合其他分析工具,如成交量,波动率等来设定过滤条件,提高策略盈利率。
-
可以研究股票选择机制,选择绩优股或加权指数等,降低个股风险。
本策略整体运作顺畅,在设定了止损止盈条件后,整体盈亏结果良好。通过参数调节和股票池筛选的优化,效果可以进一步提升。总体来说,这是一套运作稳定、易于实施的量化交易策略。
||
This strategy combines moving averages and the Stochastic oscillator to implement an automated stock trading system. It uses two moving averages of different lengths and the Stochastic indicator to capture trend and overbought/oversold signals, and makes buy and sell decisions based on the trend direction and indicator signals in overbought/oversold regions.
A fast line (5-day) and slow line (20-day) moving average are used. The fast line crossing above the slow line is a buy signal, while crossing below is a sell signal. The moving averages determine the price trend and direction.
The Stochastic parameters are set to: K line period of 14, K line smooth period of 3, D line smooth period of 3. Below 20 on the K line is the oversold region, while above 80 is the overbought region. The Stochastic oscillator determines whether it is in overbought/oversold regions.
Buy condition: Fast MA crossover above slow MA and K line <20 (oversold region) Sell condition: Fast MA crossover below slow MA and K line >80 (overbought region)
Go long when the buy condition is met; go short when the sell condition is met.
Set 1% profit target after buying; set 1% stop loss after selling.
This strategy combines trend and indicators to effectively capture medium-to-long term price trends, while using the Stochastic oscillator to control the timing of trades and avoid random entries without a clear directional bias. The strategy parameters are adjustable to different market environments. Overall this strategy works very well on large/mid-cap stocks in uptrends.
-
Price spikes from significant news events may incur large losses. Stop losses can control the risk.
-
Sustained range-bound markets may lead to consecutive small losses. Adjust the MA periods to reduce losses.
-
Avoid key market periods when prices tend to reverse.
-
Test different parameter combinations to find optimal parameters, such as different MA lengths.
-
Incorporate other analysis tools like volume, volatility for filter conditions to improve profit rate.
-
Research stock selection mechanisms, like picking strong stocks or cap-weighted indices, to reduce single-stock risks.
The overall strategy operates smoothly. With stop losses and profit targets, the overall profit/loss profile is solid. Further improvements can be expected from parameter tuning and stock pool filtering. In general this is an easy-to-implement and robust quantitative trading strategy.
[/trans]
Strategy Arguments
| Argument | Default | Description |
|---|---|---|
| v_input_1 | 5 | Short MA Length |
| v_input_2 | 20 | Long MA Length |
| v_input_3 | 14 | Stochastic Length |
| v_input_4 | 3 | Stochastic %K |
| v_input_5 | 3 | Stochastic %D |
| v_input_6 | true | Profit Target (%) |
Source (PineScript)
/*backtest
start: 2024-01-25 00:00:00
end: 2024-02-01 00:00:00
period: 5m
basePeriod: 1m
exchanges: [{"eid":"Futures_Binance","currency":"BTC_USDT"}]
*/

//@version=4
strategy("Moving Average and Stochastic Strategy 80% ", overlay=true)

// Moving Average Settings
maShortLength = input(5, title="Short MA Length")
maLongLength = input(20, title="Long MA Length")

// Stochastic Settings
stochLength = input(14, title="Stochastic Length")
smoothK = input(3, title="Stochastic %K")
smoothD = input(3, title="Stochastic %D")
stochOverbought = 80
stochOversold = 20

// Profit Target Settings
profitTarget = input(1, title="Profit Target (%)") // 1% profit target

// Calculate Moving Averages
maShort = sma(close, maShortLength)
maLong = sma(close, maLongLength)

// Calculate Stochastic
k = sma(stoch(close, high, low, stochLength), smoothK)
d = sma(k, smoothD)

// Entry Conditions
longConditionMA = crossover(maShort, maLong) and k < stochOversold
shortConditionMA = crossunder(maShort, maLong) and k > stochOverbought

// Opposite Conditions
oppositeLongConditionMA = crossunder(maShort, maLong) and k < stochOversold
oppositeShortConditionMA = crossover(maShort, maLong) and k > stochOverbought

// Strategy Logic
if (longConditionMA)
    strategy.entry("Buy", strategy.long)
    strategy.exit("Exit Buy", "Buy", profit=close * (50 + profitTarget / 100))

if (shortConditionMA)
    strategy.entry("Sell", strategy.short)
    strategy.exit("Exit Sell", "Sell", profit=close * (20 - profitTarget / 100))

// Opposite Strategy Logic
if (oppositeLongConditionMA)
    strategy.entry("Sell", strategy.short)
    strategy.exit("Exit Sell", "Sell", profit=close * (50 - profitTarget / 100))

if (oppositeShortConditionMA)
    strategy.entry("Buy", strategy.long)
    strategy.exit("Exit Buy", "Buy", profit=close * (20 + profitTarget / 100))

// Plot Moving Averages
plot(maShort, color=color.blue, title="Short MA")
plot(maLong, color=color.red, title="Long MA")

// Plot Stochastic
hline(stochOverbought, "Overbought", color=color.red)
hline(stochOversold, "Oversold", color=color.green)
plot(k, color=color.black, title="Stochastic %K")
Detail
https://www.fmz.com/strategy/440793
Last Modified
2024-02-02 10:48:37
