Name
基于RSI布林带和支撑阻力策略Rational-Trading-Robot-Powered-by-RSI-Strategy
Author
ChaoZhang
Strategy Description
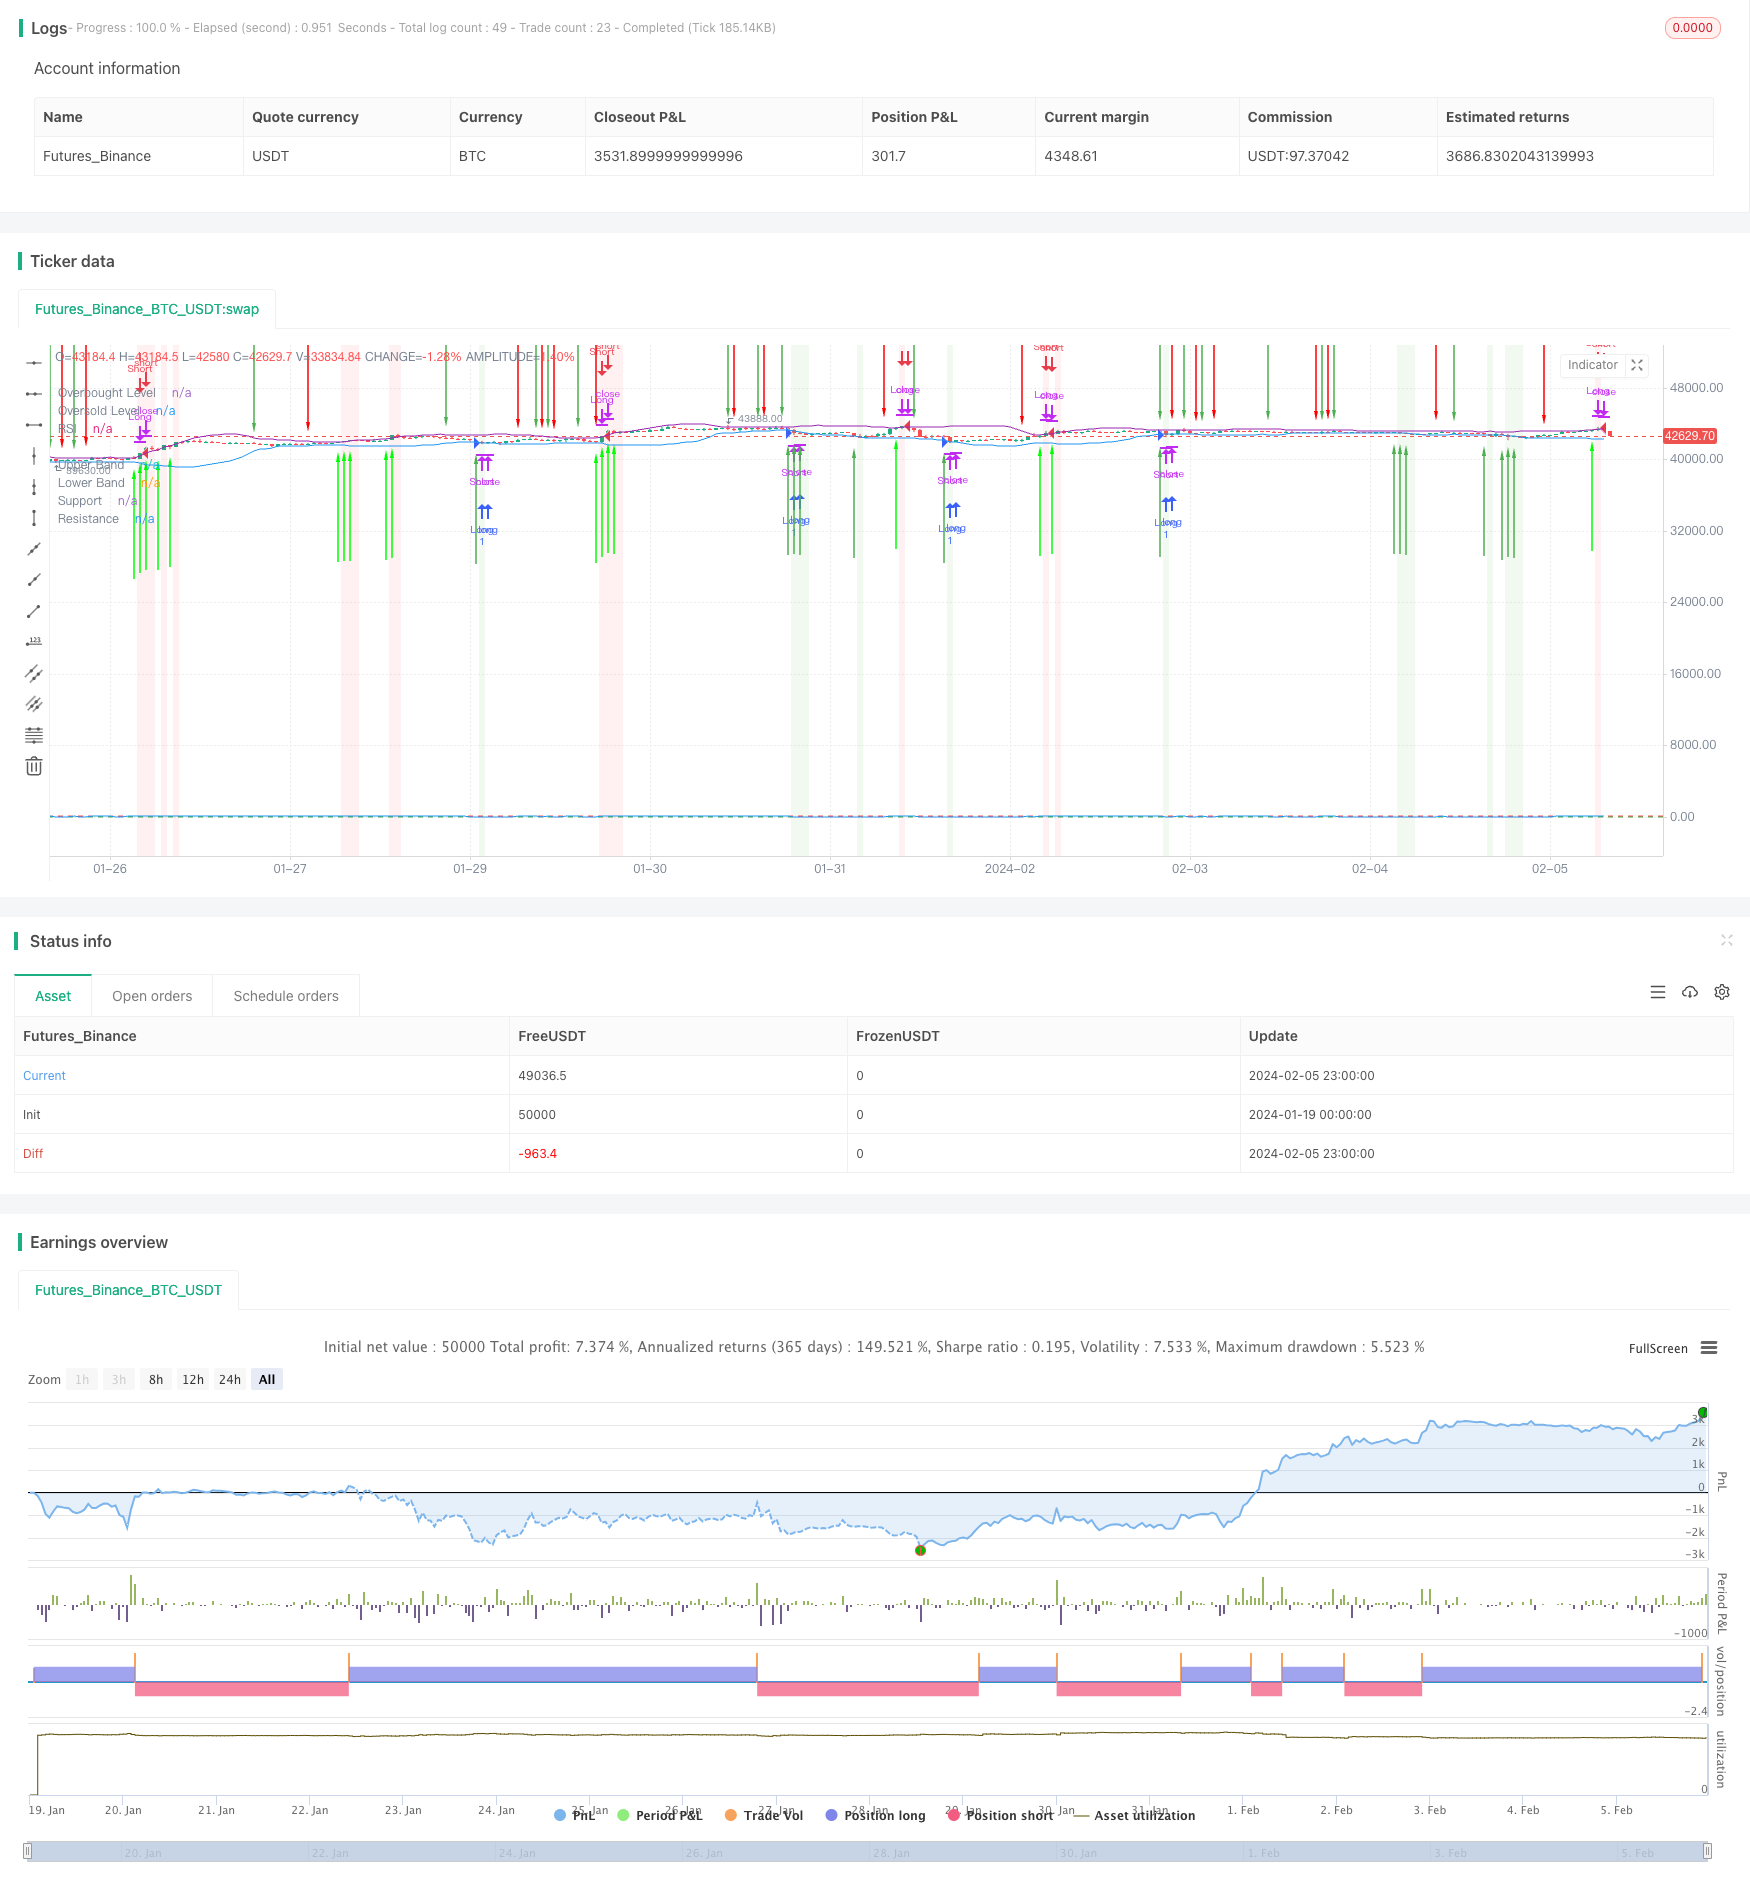
这个交易策略通过结合三个强大的技术指标——相对强强指数(RSI)、布林带和支撑阻力位,实现自动化的交易决策。该机器人能够智能地根据市场条件识别潜在的入市和出市点,从而自动下单,无需人工干预。
该交易机器人的核心逻辑基于 RSI、布林带和支撑阻力位三个指标实现。
首先,RSI 用于判断市场趋势的强弱。当 RSI 值大于 70 时,代表市场处于超买状态;当 RSI 值小于 30 时,代表市场处于超卖状态。
其次,布林带代表了市场的波动范围。布林带上轨和下轨之间就是市场正常波动的范围。当价格触及布林带上轨时,代表市场进入相对高位区域,这样的市场容易反转下跌;当价格触及布林带下轨时,代表市场进入相对低位区域,这样的市场容易反弹上涨。
最后,根据布林带上下轨位,可推导出关键的支撑阻力位。支撑位在布林带下轨附近,阻力位在布林带上轨附近。这代表着,当价格上涨至阻力位时,很可能会遇到卖盘而下跌;当价格下跌至支撑位时,很可能会遇到买盘而反弹。
综合这三个指标,该机器人的入市逻辑是:当价格触及布林带下轨(超卖区域)并且位于支撑位时,发出买入信号;当价格触及布林带上轨(超买区域)并且高点大于阻力位时,发出卖出信号。出市逻辑则是移动均线的方向转换。
-
该策略集成多个指标,能够全面判断市场状态,信号比较可靠;
-
实现全自动化交易,无需人工干预,避免错过交易机会;
-
提供实时信号提示,随时随地掌握交易情况;
-
清晰的图表标记直观显示交易点位;
-
参数可调整,能够针对不同品种和时间周期进行优化。
-
市场出现异常波动可能导致止损风险。可以设置止损位以控制最大损失。
-
机器人参数设置不当可能导致交易频率过高或信号质量差。应根据回测结果调整参数,找到最优设置。
-
系统故障可能导致信号传输中断或下单延迟。应采用稳定可靠的主机和网络进行搭建。
-
增加止损逻辑。在一定幅度损失后主动止损,有助于进一步控制风险。
-
增加资金管理模块。根据账户资金情况动态调整每笔下单的资金比例,更加智能化。
-
结合机器学习技术。收集历史数据,使用神经网络等对参数进行训练和优化,实现策略的持续演进。
-
进行全品种参数优化。现有参数可能更适合某几个品种,可以通过优化找到每个品种对应的最佳参数组合。
该交易策略具有较强的适应性和普适性。它结合多个指标判断市场状态,能够有效地把握趋势反转点,实现自动化交易。通过持续优化,可望获得更稳定的超额收益。它是一个可靠的量化交易解决方案。
||
This trading strategy incorporates three robust technical indicators - Relative Strength Index (RSI), Bollinger Bands and Support/Resistance levels to enable automated trading decisions. The robot can intelligently identify potential entry and exit points based on prevailing market conditions without manual intervention.
The core logic of this trading robot is built upon RSI, Bollinger Bands and Support/Resistance analysis.
Firstly, RSI gauges the strength of the ongoing trend. RSI above 70 implies an overbought market while RSI below 30 suggests an oversold market.
Secondly, Bollinger Bands define the volatility range of the market. The upper and lower bands encompass the normal fluctuation range of the market. Touching the upper band suggests a relatively high zone where a downside reversal is likely. Likewise, touching the lower band indicates a relatively low zone where an upside bounce is expected.
Finally, Support and Resistance levels can be derived from the Bollinger Bands. Support resides around the lower band while Resistance hovers around the upper band. This implies that an uptrend may encounter selling pressure around the Resistance, leading to a potential dip. Conversely, a downtrend may meet buying demand around the Support, prompting a technical rebound.
By consolidating these indicators, the entry logic is defined as: go long when the price touches the lower band (oversold zone) coinciding with the Support; go short when the price breaches above the upper band (overbought zone) with the high exceeding the Resistance. The exit logic is governed by the directional change of the moving average.
-
Robust signal reliability via combining multiple indicators
-
Fully automated execution without manual interference
-
Real-time alerts for instant updates on the go
-
Intuitive chart annotations to visualize trade levels
-
Customizable parameters for optimization across instruments and timeframes
-
Exceptional volatility may incur stop loss. Reasonable stop loss levels can help limit maximum loss.
-
Suboptimal parameter tuning may lead to overtrading or poor signal quality. Parameters should be fine-tuned based on backtest results for optimum setting.
-
System failure may cause signal outage or execution delays. A resilient connection and computing infrastructure is critical.
-
Incorporate stop loss logic to further restrict downside risk.
-
Introduce position sizing rules according to account equity for more intelligent risk management.
-
Leverage machine learning by training the model on historical data to improve predictive capabilities.
-
Conduct parametric optimization across various products to uncover the best parameter sets tailored to each product.
The strategy demonstrates strong adaptability and versatility. By monitoring multiple indicators to assess market conditions, it can reliably pinpoint trend reversal levels for automated execution. Continual improvements to the algorithm will elevate strategy performance to consistently generate alpha. An excelent algo-trading solution suitable for quantitative trading.
[/trans]
Strategy Arguments
| Argument | Default | Description |
|---|---|---|
| v_input_1 | 14 | RSI Length |
| v_input_2 | 70 | Overbought Level |
| v_input_3 | 30 | Oversold Level |
| v_input_4 | 20 | Bollinger Bands Length |
| v_input_5 | 2 | Bollinger Bands Multiplier |
Source (PineScript)
/*backtest
start: 2024-01-19 00:00:00
end: 2024-02-06 00:00:00
period: 1h
basePeriod: 15m
exchanges: [{"eid":"Futures_Binance","currency":"BTC_USDT"}]
*/

//@version=4
strategy("RSI, Bollinger Bands, and Support/Resistance Trading Bot", overlay=true)

// Define RSI parameters
rsiLength = input(14, title="RSI Length")
rsiOverbought = input(70, title="Overbought Level")
rsiOversold = input(30, title="Oversold Level")

// Define Bollinger Bands parameters
bbLength = input(20, title="Bollinger Bands Length")
bbMultiplier = input(2, title="Bollinger Bands Multiplier")

// Calculate RSI
rsiValue = rsi(close, rsiLength)

// Calculate Bollinger Bands
basis = sma(close, bbLength)
upperBand = basis + bbMultiplier * stdev(close, bbLength)
lowerBand = basis - bbMultiplier * stdev(close, bbLength)

// Calculate Support and Resistance based on Bollinger Bands
support = basis - bbMultiplier * stdev(close, bbLength)
resistance = basis + bbMultiplier * stdev(close, bbLength)

// Strategy logic
rsiCondition = rsiValue > rsiOverbought or rsiValue < rsiOversold
touchingUpperBand = close >= upperBand
touchingLowerBand = close <= lowerBand

// Entry conditions
longCondition = touchingLowerBand and low <= support
shortCondition = touchingUpperBand and high >= resistance

// Exit conditions
longExitCondition = crossover(close, basis)
shortExitCondition = crossunder(close, basis)

// Automatic close if moving in opposite direction
if (strategy.position_size > 0 and shortCondition)
    strategy.close("Long")

if (strategy.position_size < 0 and longCondition)
    strategy.close("Short")

// Strategy orders
strategy.entry("Long", strategy.long, when=longCondition)
strategy.entry("Short", strategy.short, when=shortCondition)

// Plot entry and exit arrows
plotarrow(series=longCondition ? 1 : na, colorup=color.new(color.green, 0), offset=-1, minheight=5)
plotarrow(series=shortCondition ? 1 : na, colordown=color.new(color.red, 0), offset=-1, minheight=5)
plotarrow(series=longExitCondition ? -1 : na, colorup=color.new(color.red, 0), offset=-1, minheight=5)
plotarrow(series=shortExitCondition ? -1 : na, colordown=color.new(color.green, 0), offset=-1, minheight=5)

// Plot Bollinger Bands on chart
plot(upperBand, title="Upper Band", color=color.red)
plot(lowerBand, title="Lower Band", color=color.green)

// Highlight areas where price touches Bollinger Bands
bgcolor(touchingUpperBand ? color.new(color.red, 90) : na)
bgcolor(touchingLowerBand ? color.new(color.green, 90) : na)

// Plot Support and Resistance
plot(support, title="Support", color=color.blue)
plot(resistance, title="Resistance", color=color.purple)

// Plot RSI on chart
hline(rsiOverbought, "Overbought Level", color=color.red)
hline(rsiOversold, "Oversold Level", color=color.green)
plot(rsiValue, title="RSI", color=color.blue)
Detail
https://www.fmz.com/strategy/442116
Last Modified
2024-02-19 14:43:34
