Name
基于移动平均线的量化交易策略Moving-Average-Crossover-Strategy
Author
ChaoZhang
Strategy Description
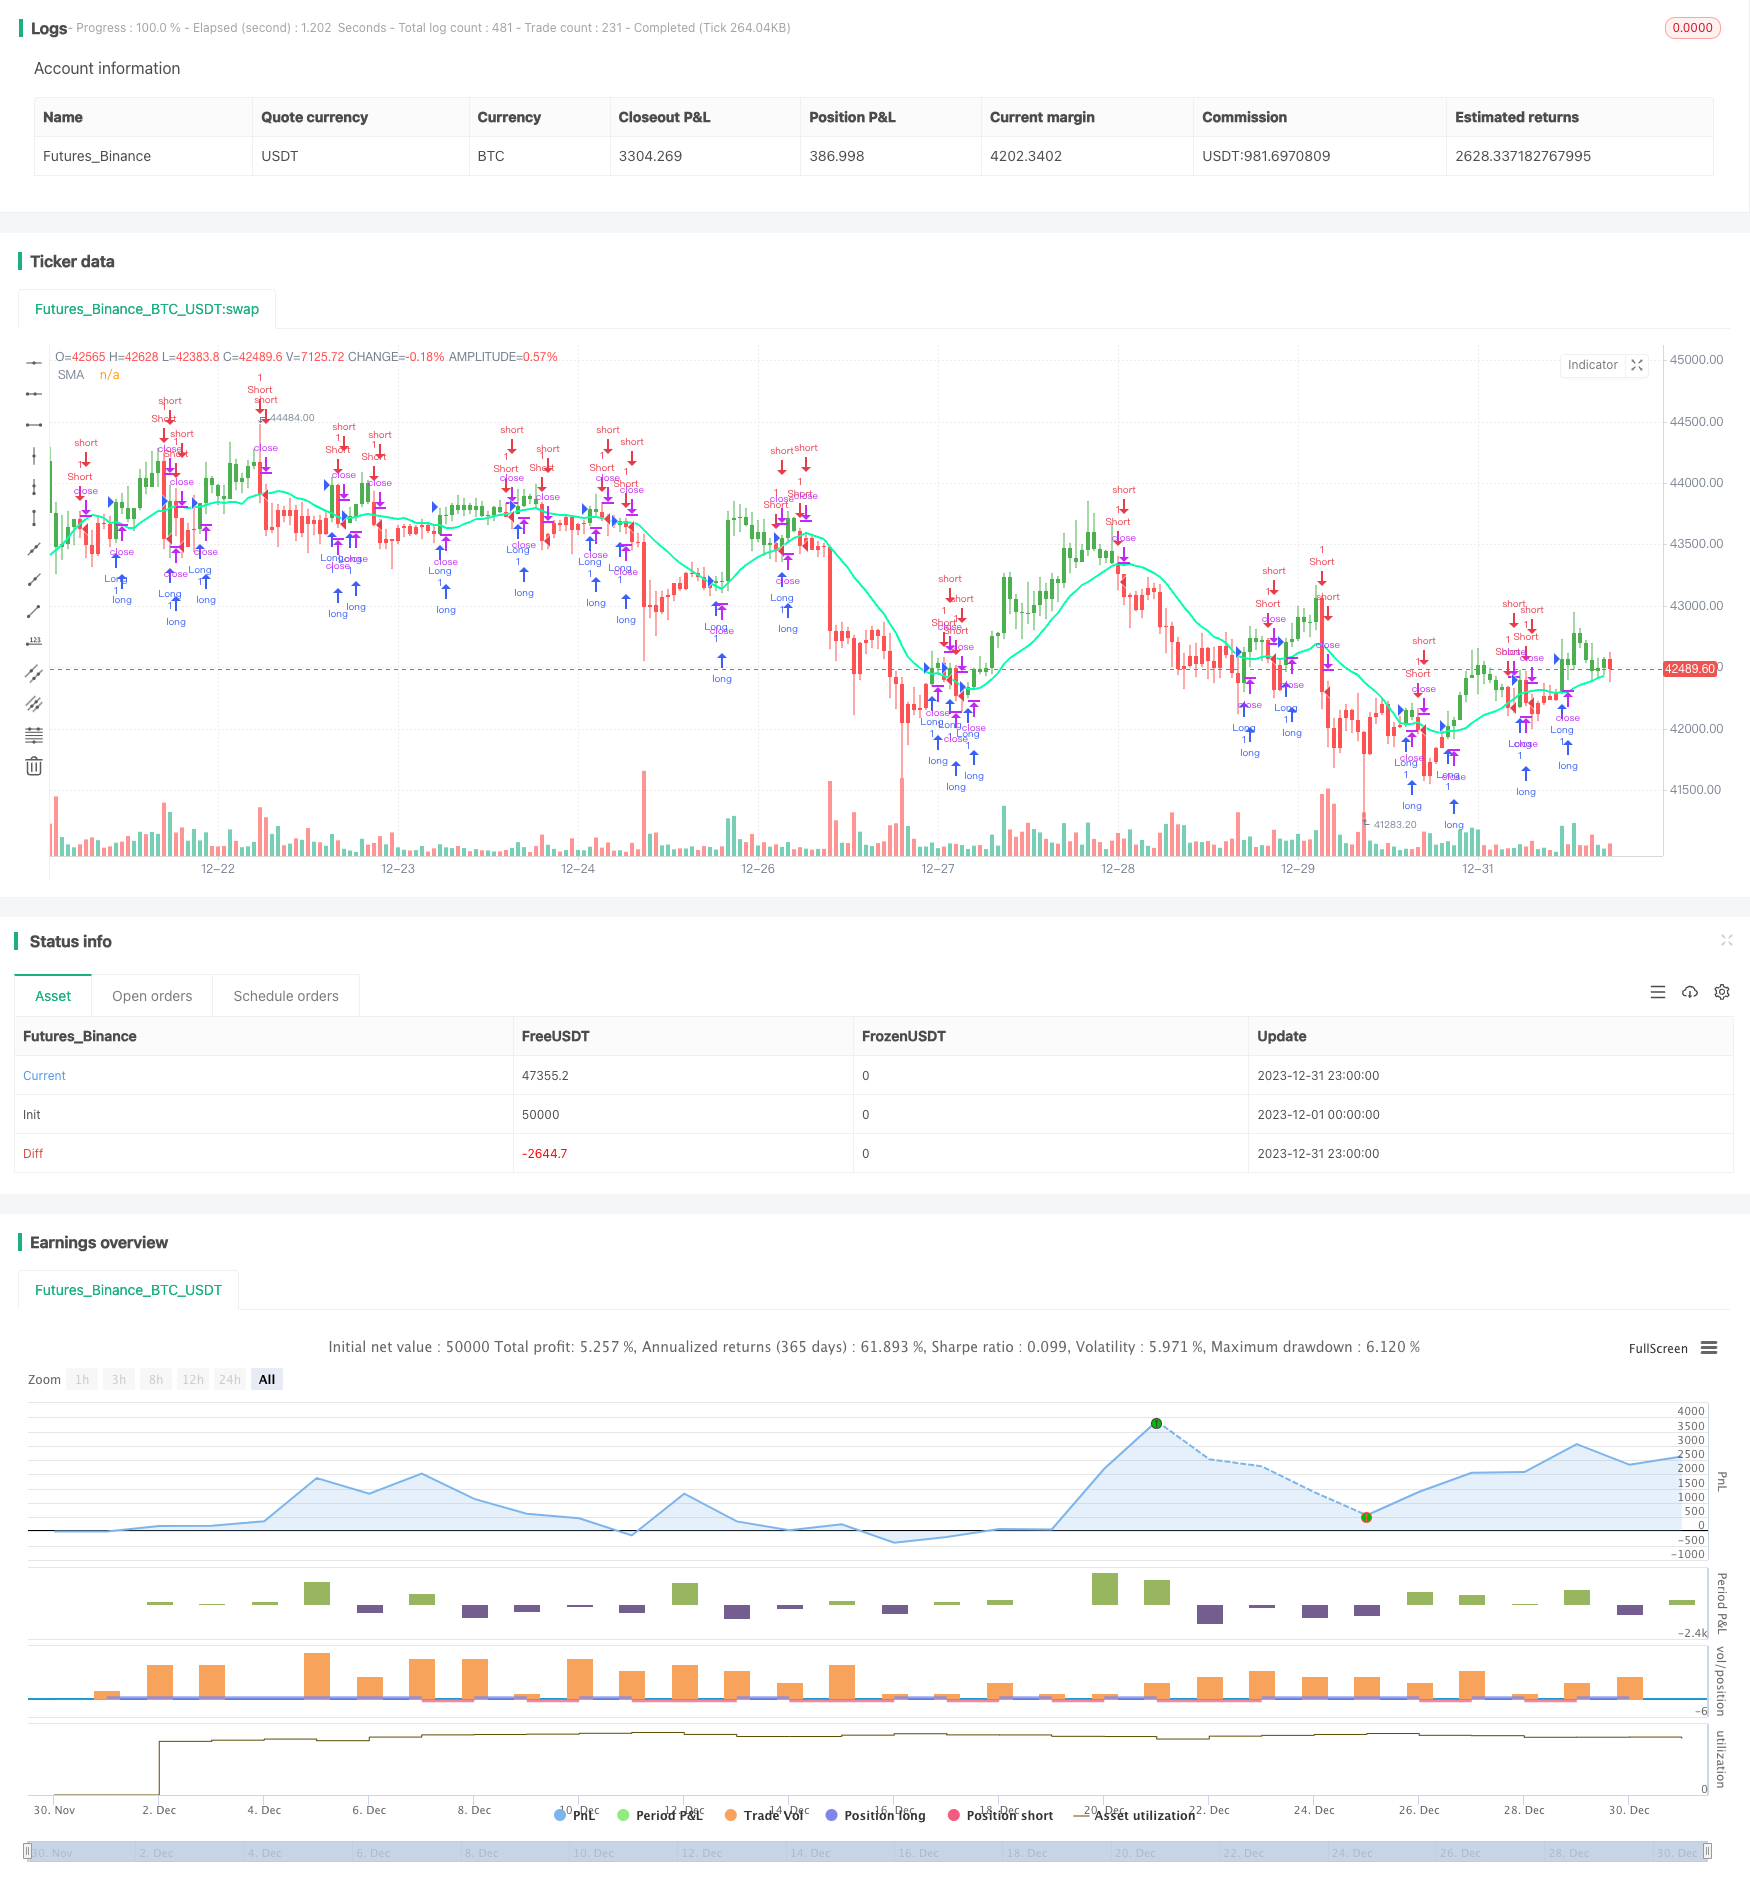
移动平均交叉策略是一个基于移动平均线的量化交易策略。该策略通过计算一段时间内的证券平均价格,利用价格的移动平均线的交叉来产生交易信号,实现盈利。
该策略主要利用快速移动平均线和慢速移动平均线的交叉来判断价格趋势和产生交易信号。具体来说,是运用两个不同周期长度的移动平均线,例如10日线和20日线。
当快速移动平均线从下方向上突破慢速移动平均线时,认为行情由跌转为涨,产生买入信号。当快速移动平均线从上方向下跌破慢速移动平均线时,认为行情由涨转为跌,产生卖出信号。
通过捕捉价格趋势的转折点,该策略可以在行情转好时买入,行情转坏时卖出,实现盈利。
该策略具有以下优势:
- 概念简单,容易理解和实现
- 可定制性强,可以调整移动平均线的周期等参数
- 回测效果较好,特别适合趋势性行情
- 可融入止盈止损逻辑,控制风险
该策略也存在以下风险:
- 在盘整行情中容易产生错误信号和过度交易
- 需要调试参数,不同的参数组合回测效果差异大
- 没有考虑交易成本和滑点,实盘效果可能弱于回测
- 存在时间滞后,可能漏掉价格快速反转的机会
可通过适当优化来减轻这些风险。
该策略可以从以下几个方向进行优化:
- 结合其他指标过滤信号,例如量能指标、震动指标等,避免在盘整中错误交易
- 添加自适应移动平均线,让周期参数动态变化,更好跟踪价格
- 优化移动平均线的周期参数,寻找最佳参数组合
- 设定再次入场条件,避免频繁交易
- 考虑实际交易成本和滑点,调整止盈止损点
通过以上优化,可以大大提高策略的实盘效果。
移动平均交叉策略整体来说是一种易于掌握和实施的量化交易策略。它利用价格平均线的交叉原理,简单且直观地判断市场走势和产生交易信号。通过参数调优和与其他技术指标的配合,可以强化该策略的实盘效果,使其成为可靠的量化盈利工具。
||
The moving average crossover strategy is a quantitative trading strategy based on moving averages. By calculating the average price of securities over a period of time, it generates trading signals through the crossover of price moving averages to make profits.
This strategy mainly uses the crossover of fast and slow moving average lines to determine price trends and generate trading signals. Specifically, it employs two moving averages with different period lengths, such as 10-day and 20-day lines.
When the fast moving average line breaks through the slow moving average line upward, the market is considered to turn from decline to rise, generating a buy signal. When the fast moving average line breaks through the slow moving average line downward, the market is thought to turn from rise to decline, producing a sell signal.
By capturing the inflection points of price trends, this strategy can buy during an improving market and sell during a worsening market to make profits.
This strategy has the following advantages:
- The concept is simple and easy to understand and implement
- Highly customizable by adjusting moving average periods etc.
- Good backtesting results, especially suitable for trending markets
- Can incorporate take profit and stop loss to control risks
This strategy also has the following risks:
- Prone to generating false signals and overtrading during range-bound markets
- Parameter tuning needed as different parameter sets lead to varied backtest results
- Ignores transaction costs and slippage, actual results likely weaker than backtest
- Time lag exists, may miss opportunities from fast price reversals
These risks can be alleviated through appropriate optimizations.
This strategy can be optimized in the following aspects:
- Add filters like volume and volatility indicators to avoid wrong trades during consolidations
- Employ adaptive moving averages to allow dynamic period changes for better trend following
- Optimize moving average periods to find best parameter sets
- Set re-entry conditions to prevent excessive trades
- Consider actual trading costs and slippage, adjust take profit and stop loss
The above optimizations can greatly improve the actual performance of the strategy.
In summary, the moving average crossover strategy is an easy to grasp and implement quantitative trading strategy. It judges market trends and generates trading signals through the intuitive principle of price average line crossovers. With parameter tuning and combinations with other technical indicators, it can strengthen the actual performance of this strategy and make it a reliable profit generator.
[/trans]
Strategy Arguments
| Argument | Default | Description |
|---|---|---|
| v_input_1 | D | Resolution |
| v_input_2_close | 0 | Source: close |
| v_input_3 | 14 | Length |
| v_input_4_close | 0 | Trigger Price: close |
| v_input_5 | 50 | Take Profit |
| v_input_6 | 20 | Stop Loss |
| v_input_7 | false | Use TakeStop |
| v_input_8 | true | Painting bars |
| v_input_9 | true | Show Line |
| v_input_10 | false | Use Alerts |
| v_input_11 | false | Trade Reverse |
Source (PineScript)
/*backtest
start: 2023-12-01 00:00:00
end: 2023-12-31 23:59:59
period: 1h
basePeriod: 15m
exchanges: [{"eid":"Futures_Binance","currency":"BTC_USDT"}]
*/

// This source code is subject to the terms of the Mozilla Public License 2.0 at https://mozilla.org/MPL/2.0/
// © HPotter
//  Simple SMA strategy
//
// WARNING:
//      - For purpose educate only
//      - This script to change bars colors
//@version=4
strategy(title="Simple SMA Strategy Backtest", shorttitle="SMA Backtest", precision=6, overlay=true)
Resolution = input(title="Resolution", type=input.resolution, defval="D")
Source = input(title="Source", type=input.source, defval=close)
xSeries = security(syminfo.tickerid, Resolution, Source)
Length = input(title="Length", type=input.integer, defval=14, minval=2)
TriggerPrice = input(title="Trigger Price", type=input.source, defval=close)
TakeProfit = input(50, title="Take Profit", step=0.01)
StopLoss = input(20, title="Stop Loss", step=0.01)
UseTPSL = input(title="Use Take\Stop", type=input.bool, defval=false)
BarColors = input(title="Painting bars", type=input.bool, defval=true)
ShowLine = input(title="Show Line", type=input.bool, defval=true)
UseAlerts = input(title="Use Alerts", type=input.bool, defval=false)
reverse = input(title="Trade Reverse", type=input.bool, defval=false)
pos = 0
xSMA = sma(xSeries, Length)
pos := iff(TriggerPrice > xSMA, 1,
         iff(TriggerPrice < xSMA, -1, nz(pos[1], 0)))
nRes = ShowLine ? xSMA : na
alertcondition(UseAlerts == true and pos != pos[1] and pos == 1, title='Signal Buy', message='Strategy to change to BUY')
alertcondition(UseAlerts == true and pos != pos[1] and pos == -1, title='Signal Sell', message='Strategy to change to SELL')
alertcondition(UseAlerts == true and pos != pos[1] and pos == 0, title='FLAT', message='Strategy get out from position')
possig =iff(pos[1] != pos,
         iff(reverse and pos == 1, -1,
           iff(reverse and pos == -1, 1, pos)), 0)
if (possig == 1)
    strategy.entry("Long", strategy.long)
if (possig == -1)
    strategy.entry("Short", strategy.short)

if (UseTPSL)
    strategy.close("Long", when = high > strategy.position_avg_price + TakeProfit, comment = "close buy take profit")
    strategy.close("Long", when = low < strategy.position_avg_price - StopLoss, comment = "close buy stop loss")
    strategy.close("Short", when = low < strategy.position_avg_price - TakeProfit, comment = "close buy take profit")
    strategy.close("Short", when = high > strategy.position_avg_price + StopLoss, comment = "close buy stop loss")
nColor = BarColors ? strategy.position_avg_price != 0  and pos == 1 ? color.green :strategy.position_avg_price != 0 and pos == -1 ? color.red : color.blue : na
barcolor(nColor)
plot(nRes, title='SMA', color=#00ffaa, linewidth=2, style=plot.style_line)
Detail
https://www.fmz.com/strategy/440107
Last Modified
2024-01-26 16:29:23
