Name
基于移动平均线交叉突破策略Crossing-Moving-Average-Breakout-Strategy
Author
ChaoZhang
Strategy Description
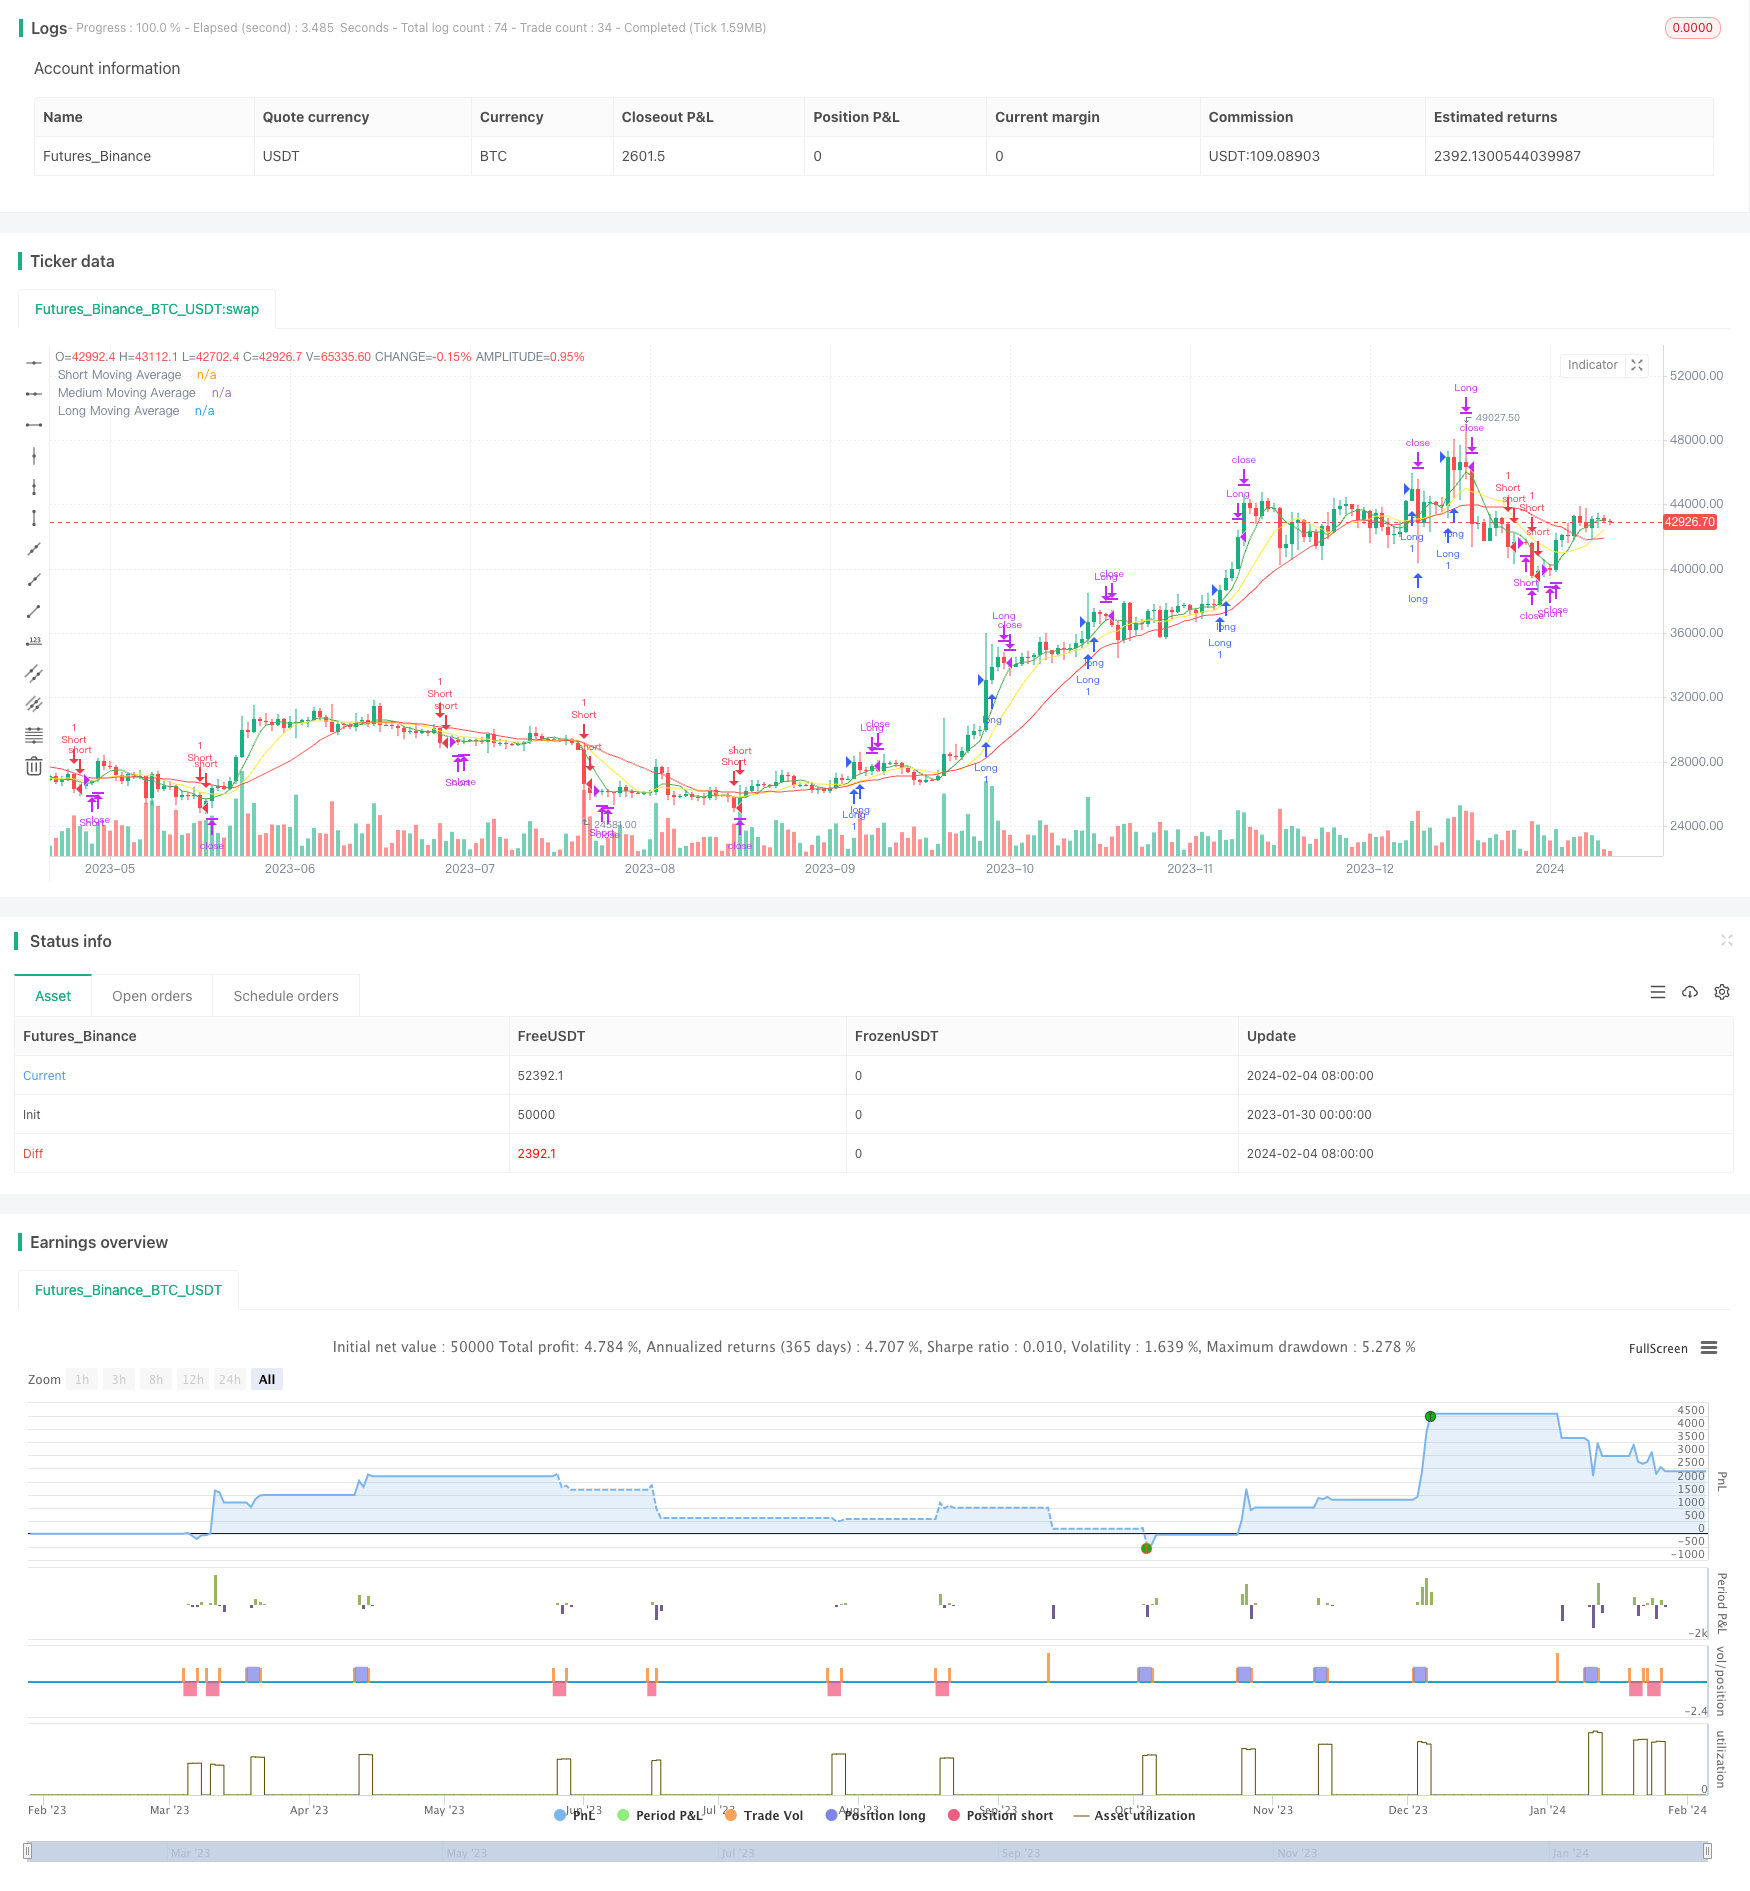
本策略运用三条不同周期的移动平均线,识别市场趋势方向。当三条移动平均线方向一致时,进入仓位。同时,结合最近N根K线的最高价或最低价,设定止损止盈。
-
计算长期、中期、短期三条移动平均线。用户可以自行设置周期。默认为20日、10日、5日。
-
比较三条移动平均线的方向。当短期移动平均线上穿中期,中期上穿长期时,判断为多头市场。当短期移动平均线下穿中期,中期下穿长期时,判断为空头市场。
-
在多头市场中,如果价格突破最近N根K线内的最高价,做多;在空头市场中,如果价格突破最近N根K线内的最低价,做空。N也为用户自定义参数。
-
进入仓位后,设置止损止盈。多头市场止损为最近N根K线内的最低价,空头市场止损为最近N根K线内的最高价。
本策略结合移动平均线指标和K线图形,能较好判断市场走势。同时,止损止盈设置合理,有利于规避较大亏损。
相比单一移动平均线等指标,本策略运用三条移动平均线,判断市场走势的可靠性更高。同时,突破最近N根K线最高价或最低价进入仓位,是比较常见的突破策略。整体而言,策略思路清晰,易于实施。
该策略可能存在的主要风险有:
-
三条移动平均线方向判断失误的概率。如果中短期移动平均线造成错误信号,可能导致不必要的亏损。
-
突破进入时机选择不当,容易被套。应适当优化入场时机选择。
-
止损距离设置过小,扩大止损距离有助于给予价格更多Running Room。
本策略可从以下几个方向进行优化:
-
增加其他指标过滤,确保移动平均线信号的可靠性。例如增加成交量的多空判断。
-
优化移动平均线的周期参数,使其更好适应不同品种。
-
增加机器学习算法,实现参数的自动优化。
-
在高频数据上测试该策略的有效性。
本策略总体较为简单通用,思路清晰,实际可行性强。作为移动平均线交叉系统的范例,是初学者常见的选择。通过适当优化,可将系统运用到更广泛的品种和时间周期上,从而获得稳定收益。
||
This strategy uses three moving averages of different periods to identify the market trend direction. It enters a position when the three moving averages are moving in the same direction. At the same time, combined with the highest or lowest price of the most recent N candles, it sets stop loss and take profit.
-
Calculate the long term, medium term and short term three moving averages. Users can set the periods by themselves. The default values are 20, 10 and 5.
-
Compare the directions of the three moving averages. When the short term moving average crosses above the medium term one, and the medium term crosses above the long term one, it is judged as a bull market. When the short term crosses below the medium term, and the medium term crosses below the long term, it is judged as a bear market.
-
In a bull market, if the price breaks through the highest price of the most recent N candles, go long; in a bear market, if the price breaks through the lowest price of the most recent N candles, go short. N is also a customizable parameter by users.
-
After entering a position, set stop loss and take profit. The stop loss in a bull market is set to be the lowest price of the most recent N candles, and that in a bear market is set to be the highest price.
This strategy combines the moving average indicator and candlestick charts, which can better determine the market trend. At the same time, the setting of stop loss and take profit is reasonable, which is conducive to avoiding greater losses.
Compared with a single moving average and other indicators, this strategy uses three moving averages to judge the market trend more reliably. Meanwhile, entering a position when breaking through the highest or lowest price of the most recent N candles is a common breakout strategy. Overall, the strategy idea is clear and easy to implement.
The main potential risks of this strategy are:
-
The probability of erroneous judgment on the direction of the three moving averages. If the medium-short term moving averages cause wrong signals, unnecessary losses may be caused.
-
Improper selection of the timing to enter the position, which is easy to be trapped in. The timing of entries should be appropriately optimized.
-
The stop loss distance is set too small. Expanding the stop loss distance helps to allow more running room for the price.
The directions to optimize this strategy include:
-
Add other indicators for filtration to ensure the reliability of moving average signals. For example, add the long/short judgment of trading volume.
-
Optimize the moving average periods to better adapt them to different products.
-
Add machine learning algorithms to achieve automatic parameter optimization.
-
Test the effectiveness of this strategy on high frequency data.
This strategy is relatively simple and universal. The idea is clear with strong feasibility. As an example of a moving average crossover system, it is a common choice for beginners. Through proper optimization, the system can be applied to more products and time frames to obtain steady returns.
[/trans]
Strategy Arguments
| Argument | Default | Description |
|---|---|---|
| v_input_1 | 20 | Long Period |
| v_input_2 | 10 | Medium Period |
| v_input_3 | 5 | Short Period |
| v_input_string_1 | 0 | MA type: SMA |
| v_input_4 | 10 | Candles Back |
| v_input_5 | 3 | Bars to Exit |
Source (PineScript)
/*backtest
start: 2023-01-30 00:00:00
end: 2024-02-05 00:00:00
period: 1d
basePeriod: 1h
exchanges: [{"eid":"Futures_Binance","currency":"BTC_USDT"}]
*/

// This Pine Script™ code is subject to the terms of the Mozilla Public License 2.0 at https://mozilla.org/MPL/2.0/
// © hobbiecode

//@version=5
strategy("Cross Breakout - Hobbiecode", shorttitle="Cross - HOBBIE", overlay=true)

// User-defined input for moving averages
long_period = input(20, title="Long Period")
medium_period =  input(10, title = "Medium Period")
short_period = input(5, title="Short Period")
type_ma = input.string("SMA", title = "MA type", options = ["SMA", "EMA"])
candles_back = input(10, title = "Candles Back")
bars_valid = input(3, title = "Bars to Exit")

// Calculating moving averages
long_ma = 0.0
medium_ma = 0.0
short_ma = 0.0

if type_ma == "SMA"
    long_ma := ta.sma(close, long_period)
    medium_ma := ta.sma(close, medium_period)
    short_ma := ta.sma(close, short_period)
else
    long_ma := ta.ema(close, long_period)
    medium_ma := ta.ema(close, medium_period)
    short_ma := ta.ema(close, short_period)

// Plot moving averages
plot(long_ma, title="Long Moving Average", color=color.red)
plot(medium_ma, title = "Medium Moving Average", color = color.yellow)
plot(short_ma, title="Short Moving Average", color=color.green)

// Check last min/max
last_min = ta.lowest(candles_back)
last_max = ta.highest(candles_back)

// Strategy logic for crossing of moving averages
longCondition = short_ma > medium_ma and medium_ma > long_ma and high == last_max
shortCondition = short_ma < medium_ma and medium_ma < long_ma and low == last_min

longCondition_entry = longCondition and strategy.position_size == 0
shortCondition_entry = shortCondition and strategy.position_size == 0

// Check last min/max for operation
last_min_op = ta.lowest(candles_back)[1]
last_max_op = ta.highest(candles_back)[1]

// Plot lines
var line r1Line = na

// Entry orders
// if (longCondition)
//     from_line = chart.point.now(high)
//     to_line = chart.point.from_index(bar_index + candles_back, high)
//     r1Line := line.new(from_line, to_line, color = color.green, width = 2)

if longCondition_entry and ta.crossover(close,last_max_op)
    strategy.entry("Long", strategy.long)
    strategy.exit("Exit Long", from_entry="Long", stop=low)

// if (shortCondition)
//     from_line = chart.point.now(low)
//     to_line = chart.point.from_index(bar_index + candles_back, low)
//     r1Line := line.new(from_line, to_line, color = color.red, width = 2)

if shortCondition_entry and ta.crossunder(close,last_min_op)
    strategy.entry("Short", strategy.short)
    strategy.exit("Exit Short", from_entry="Short", stop=high)

if ta.barssince(longCondition_entry) >= bars_valid
    strategy.close("Long")

if ta.barssince(shortCondition_entry) >= bars_valid
    strategy.close("Short")
Detail
https://www.fmz.com/strategy/441182
Last Modified
2024-02-06 15:02:33
