Name
基于改进型MACD指标的短线交易策略Reverse-Momentum-Trading-Strategy
Author
ChaoZhang
Strategy Description
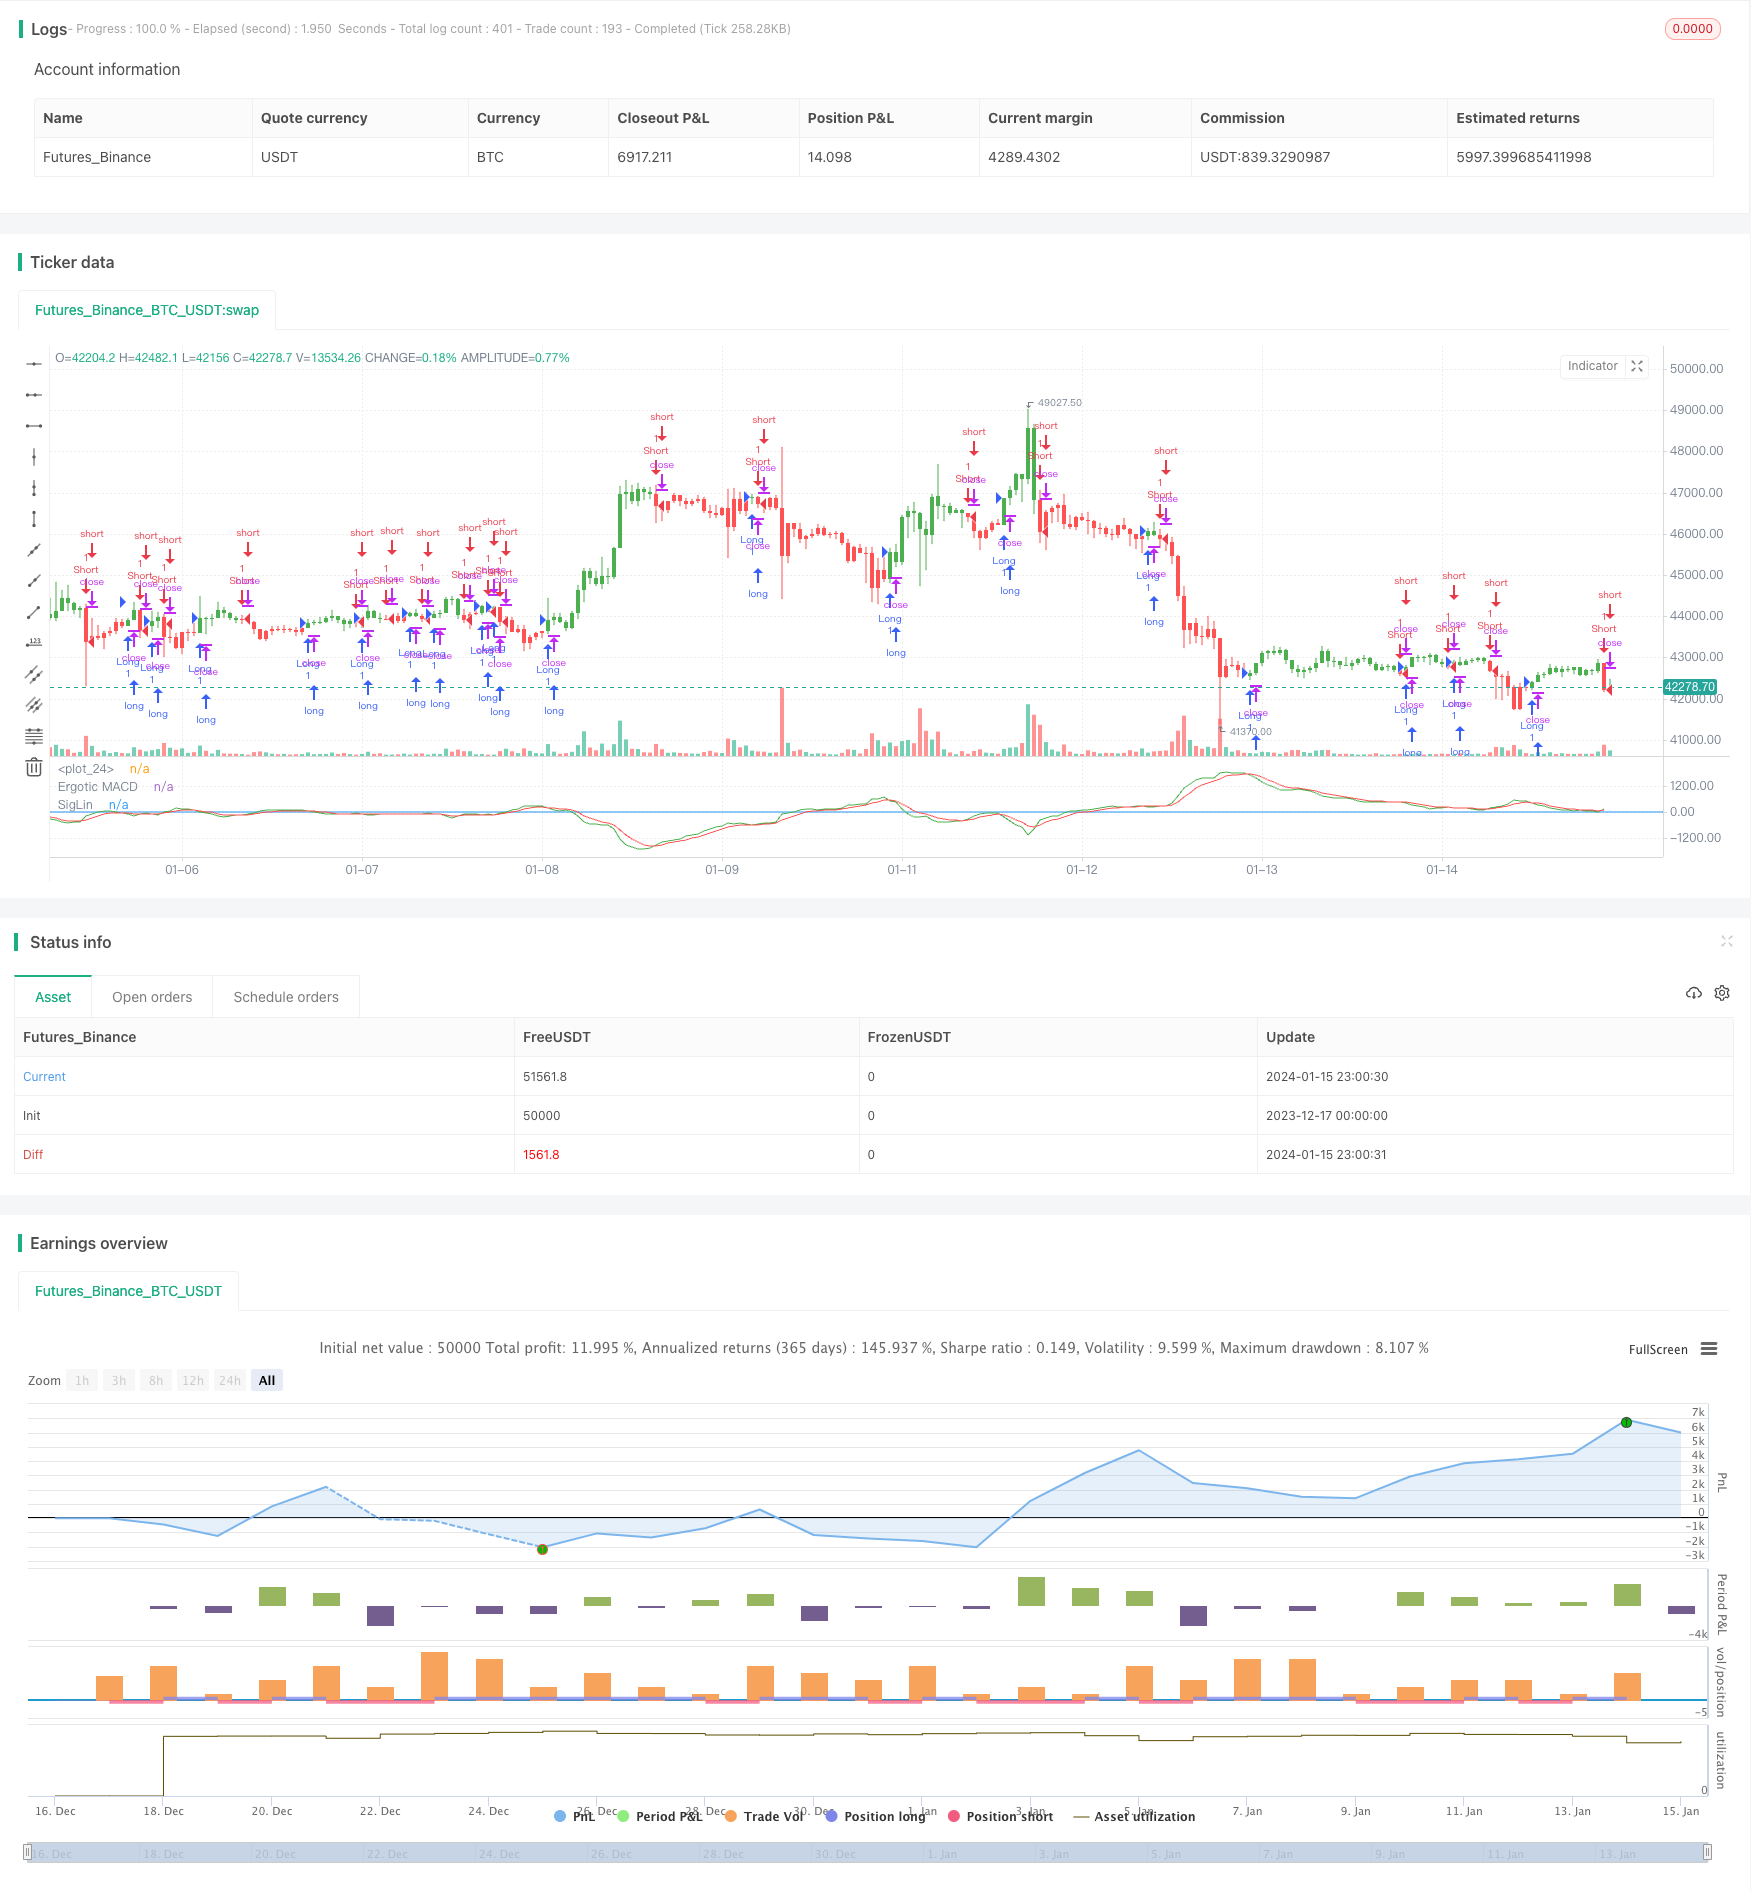
反向动量交易策略(Reverse Momentum Trading Strategy)是一个基于改进型MACD指标的短线交易策略。该策略借鉴了William Blau在他的著作《动量,方向和背离》(Momentum, Direction and Divergence)中提出的思想,利用价格与动量之间的关系,构建一个与标准MACD指标意义相反的自定义MACD指标,在指标形成买卖信号时进行反向操作,即买入该指标卖出信号,卖出该指标买入信号。
该策略的核心指标是改进型MACD,指标公式如下:
fastMA = ema(close, 32)
slowMA = ema(close, 5)
xmacd = fastMA - slowMA
xMA_MACD = ema(xmacd, 5)
其中,fastMA是32周期的指数移动平均线,slowMA是5周期的指数移动平均线。两条移动平均线的差值构成xmacd,再对xmacd计算5周期指数移动平均得到xMA_MACD。
当xmacd上穿xMA_MACD时生成卖出信号,当xmacd下穿xMA_MACD时生成买入信号。该信号意义与标准MACD指标相反,标准MACD指标上穿发出买入信号,下穿发出卖出信号。
-
利用价格与动量关系,捕捉潜在趋势反转机会。
-
改进型MACD指标设定更科学,参数优化充分,可减少假信号。
-
反向操作思路独特,增加策略系统多样性。
-
可在趋势市场中获利,也可在盘整市场中获利。
-
反向操作风险高,需要谨慎使用。
-
须防止止损点过小而被止损。可适当放宽止损范围,降低被套风险。
-
须警惕反转信号漏失而错过反转机会。可适当优化参数,减少信号漏失。
-
须防止效率过低而亏损。可测试不同品种参数效果,选择效率更高品种交易。
-
测试不同长短周期参数组合优化指标形态。
-
加入趋势判断指标,避免行情剧烈波动期反向做多做空。
-
结合波浪理论、支撑阻力位等技术指标判断潜在反转机会。
-
优化止损机制,防止过于激进的止损被套。
反向动量交易策略整合多种技术分析理论与指标信号,在价格与动量背离时捕捉反转机会。该策略思路新颖,具有很强的实用价值。但反向操作风险较大,需要严格的资金管理,谨慎的参数优化与风险控制,方能获得稳定收益。
||
The Reverse Momentum Trading Strategy is a short-term trading strategy based on an improved MACD indicator. The strategy draws on the ideas proposed by William Blau in his book "Momentum, Direction and Divergence", using the relationship between price and momentum to construct a custom MACD indicator that has the opposite meaning to the standard MACD indicator. It takes reverse operations at the indicator buy and sell signals, i.e. go long on sell signals and go short on buy signals.
The core indicator of the strategy is the improved MACD. Its formula is:
fastMA = ema(close, 32)
slowMA = ema(close, 5)
xmacd = fastMA - slowMA
xMA_MACD = ema(xmacd, 5)
Where fastMA is the 32-period exponential moving average, slowMA is the 5-period exponential moving average. The difference between the two moving averages makes up xmacd, and xMA_MACD is the 5-period exponential moving average of xmacd.
A sell signal is generated when xmacd crosses above xMA_MACD, and a buy signal is generated when xmacd crosses below xMA_MACD. The signal meanings are opposite to the standard MACD indicator, where the standard MACD issues buy signals when crossing up and sell signals when crossing down.
-
Captures potential trend reversal opportunities using price-momentum relationship.
-
Improved MACD settings more scientific, parameters optimized, helps avoid false signals.
-
Unique reverse operation idea increases strategy diversity.
-
Profitable in both trending and range-bound markets.
-
High risk in reverse trading, use with caution.
-
Avoid stops too tight resulting in stop-outs. Can loosen stops to lower risk.
-
Beware of missing reversal signals. Can optimize parameters to reduce signal loss.
-
Avoid low efficiency leading losses. Can test parameters on different products to select higher efficiency ones.
-
Test different long and short term parameter combinations to optimize indicator patterns.
-
Add trend judgment indicators to avoid extreme market volatility periods.
-
Incorporate technical tools like Elliott Waves, supports & resistances to determine potential reversal opportunities.
-
Optimize stop mechanisms to prevent over-aggressive stop-outs.
The Reverse Momentum Trading Strategy integrates various technical analysis theories and indicator signals to capture reversal opportunities when price diverges from momentum. With its innovative logic, it has strong practical value. But the high risks in reverse trading calls for strict money management, careful parameter optimization and risk control to generate steady profits.
[/trans]
Strategy Arguments
| Argument | Default | Description |
|---|---|---|
| v_input_1 | 32 | r |
| v_input_2 | 5 | SmthLen |
| v_input_3 | false | Trade reverse |
Source (PineScript)
/*backtest
start: 2023-12-17 00:00:00
end: 2024-01-16 00:00:00
period: 1h
basePeriod: 15m
exchanges: [{"eid":"Futures_Binance","currency":"BTC_USDT"}]
*/

//@version = 2
////////////////////////////////////////////////////////////
//  Copyright by HPotter v1.0 09/12/2016
// This is one of the techniques described by William Blau in his book
// "Momentum, Direction and Divergence" (1995). If you like to learn more,
// we advise you to read this book. His book focuses on three key aspects
// of trading: momentum, direction and divergence. Blau, who was an electrical
// engineer before becoming a trader, thoroughly examines the relationship
// between price and momentum in step-by-step examples. From this grounding,
// he then looks at the deficiencies in other oscillators and introduces some
// innovative techniques, including a fresh twist on Stochastics. On directional
// issues, he analyzes the intricacies of ADX and offers a unique approach to help
// define trending and non-trending periods.
// Blau`s indicator is like usual MACD, but it plots opposite of meaningof
// stndard MACD indicator.
//
// You can change long to short in the Input Settings
// Please, use it only for learning or paper trading. Do not for real trading.
////////////////////////////////////////////////////////////
strategy(title="Ergotic MACD Strategy Backtest")
r = input(32, minval=1)
SmthLen = input(5, minval=1)
reverse = input(false, title="Trade reverse")
hline(0, color=blue, linestyle=line)
source = close
fastMA = ema(source, r)
slowMA = ema(source, 5)
xmacd = fastMA - slowMA
xMA_MACD = ema(xmacd, 5)
pos = iff(xmacd < xMA_MACD, 1,
	   iff(xmacd > xMA_MACD, -1, nz(pos[1], 0)))
possig = iff(reverse and pos == 1, -1,
          iff(reverse and pos == -1, 1, pos))
if (possig == 1)
    strategy.entry("Long", strategy.long)
if (possig == -1)
    strategy.entry("Short", strategy.short)
barcolor(possig == -1 ? red: possig == 1 ? green : blue )
plot(xmacd, color=green, title="Ergotic MACD")
plot(xMA_MACD, color=red, title="SigLin")
Detail
https://www.fmz.com/strategy/439101
Last Modified
2024-01-17 17:29:08
