Name
基于布林带跟踪策略The-Bollinger-Bands-Tracking-Strategy
Author
ChaoZhang
Strategy Description
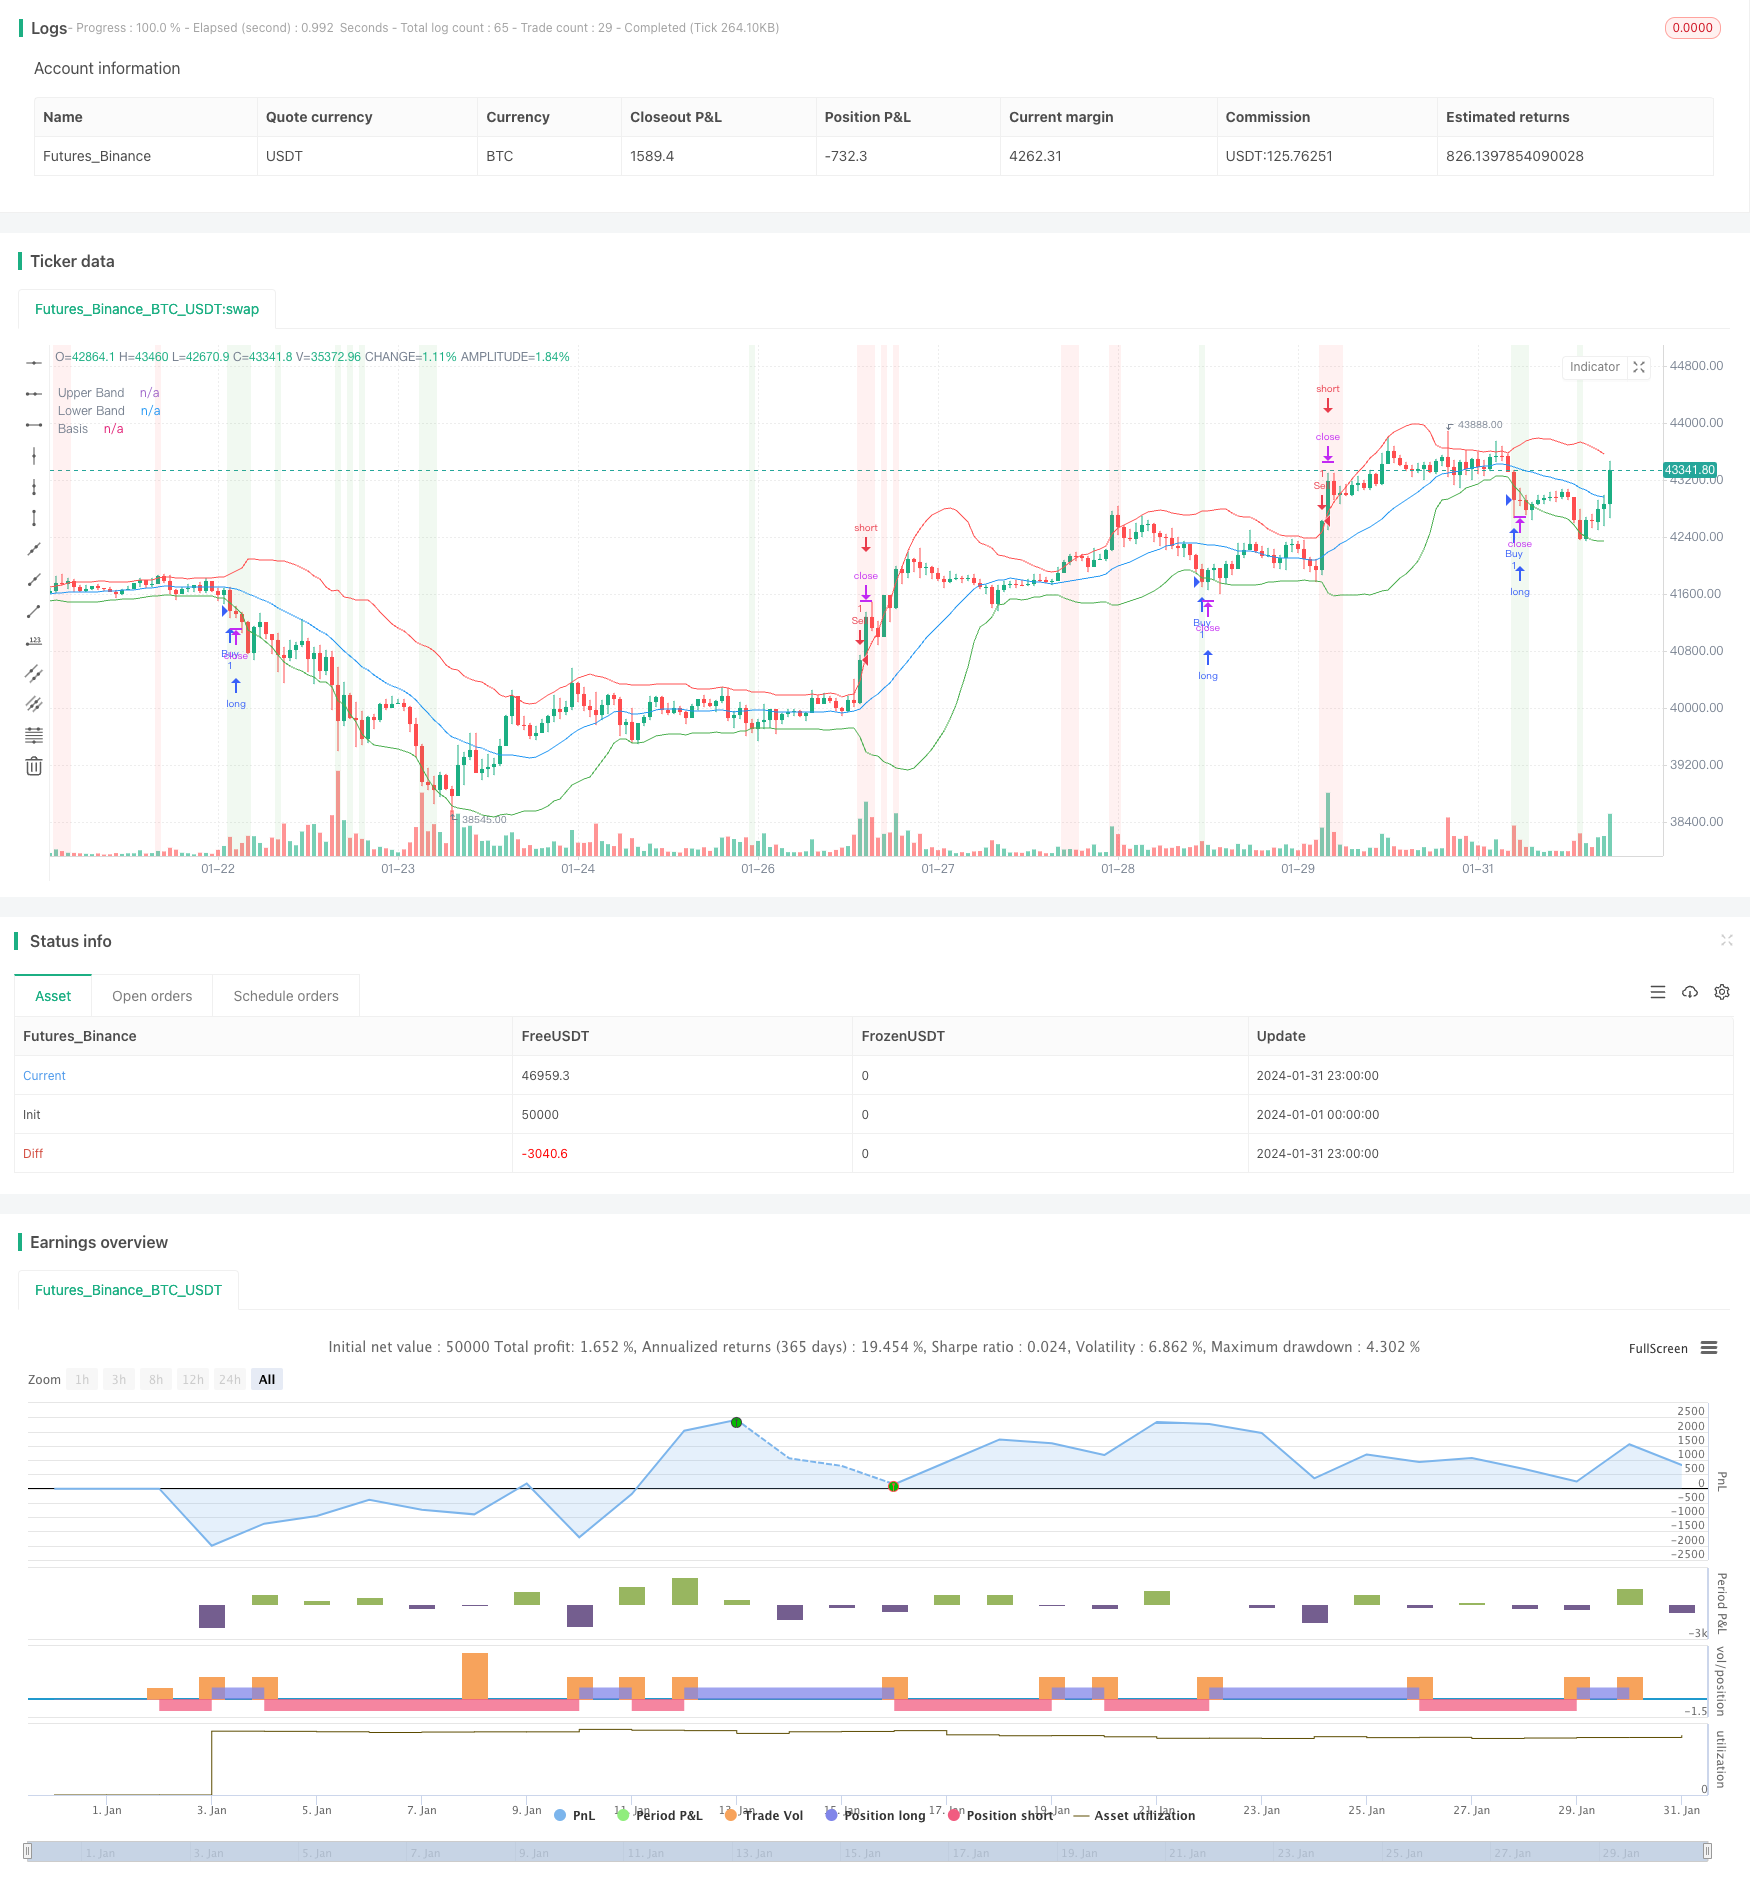
布林带跟踪策略是一种基于布林带的量化交易策略。该策略通过计算某只股票的布林带上下轨,并设置买入和卖出条件来实现对市场的跟踪。当价格触碰布林带下轨时,认为股票被低估, Therefore corresponding more space for growth, thus a buying signa提出买入信号;当价格上升触碰布林带上轨时,认为股票被高估,提出卖出信号。
该策略的核心指标是布林带。布林带由中轨、上轨和下轨三条线组成。中轨线是n天收盘价的移动平均线;上轨线是中轨线+k倍的n天收盘价标准差;下轨线是中轨线-k倍的n天收盘价标准差。k值一般设置为2。当股价低于下轨时,是比较低价位, Therefore considered to be lowervalued,提出买入信号;当股价高于上轨时,是比较高价位,认为股价被高估,提出卖出信号。
具体来说,该策略首先计算20日收盘价的移动平均线作为中轨,再计算20日收盘价标准差的2倍作为带宽,中轨+带宽为上轨,中轨-带宽为下轨。之后设置买入条件为收盘价低于下轨, 卖出条件为收盘价高于上轨。当收盘价低于下轨时,产生买入信号;当收盘价高于上轨时,产生卖出信号。
该策略具有以下几个优势:
- 原理简单,容易理解和实现。
- 可跟踪市场走势,自动发出买入和卖出信号。
- 回撤风险相对较小,具有一定的跟踪止损功能。
- 可过滤假突破,避免在震荡行情中mistakencisisions错误操作。
- 可通过调整参数如周期、标准差倍数等来适应不同股票和市场环境。
该策略也存在一些风险:
- 布林带并不是完美的买卖点指标,买卖信号可能滞后。
- 无法预测极端行情, black swan events like-those面对金融危机等黑天鹅事件效果可能不佳。
- 股价可能长期运行在布林带一侧,导致信号不足。
- 参数设置如周期长度需要优化,否则可能过于灵敏或迟钝。
对应解决方法如下:
- 组合其他指标确认买卖时机
- 设置止损止盈,控制最大损失
- 优化参数,提高参数的适应性
- 采用复合策略,避免单一依赖
该策略的主要优化方向包括:
- 优化布林带参数,如试验不同的周期长度、标准差倍数参数,fitting最佳参数。
- 结合其他指标 filtergenerating买卖判断,如KDJ,MACD等,避免布林带滞后问题。
- 应用机器学习算法 guide最优参数设定。
- 利用deep learning深度学习预测股价突破上下轨的可能性。
- 采用复合策略,设置备用交易策略, diverseavoiding过度依赖单一策略风险。
布林带跟踪策略整体来说是一种较为简单实用的量化交易策略。它可以自动跟踪股价趋势,Also provide买卖信号。优点是易于实现,风险较小,能过滤假突破。但也存在一定的滞后性, black swaninability to面对极端行情的风险。该策略可以通过优化参数和指标、Using more advanced techniques如机器学习等来进一步增强。总体而言,布林带策略组合其他技术策略,能够形成稳健高效的量化交易体系。
||
The Bollinger Bands tracking strategy is a quantitative trading strategy based on Bollinger Bands. It calculates the upper and lower rails of the Bollinger Bands of a stock and sets buy and sell conditions to track the market. When the price touches the lower rail of the Bollinger Bands, the stock is considered undervalued, Thus providing more room for growth and generating a buy signal; when the price rises and touches the upper rail, the stock is considered overvalued, genTherefore considered to beerating a sell sign.
The core indicator of this strategy is Bollinger Bands. Bollinger Bands consist of three lines: middle rail, upper rail and lower rail. The middle rail is the n-day moving average closing price; the upper rail is the middle rail + k times the n-day standard deviation of the closing price; the lower rail is the middle rail - k times the n-day standard deviation of the closing price. The k value is usually set to 2. When the stock price is lower than the lower rail, it is at a relatively low price level, Therefore considered to be lowervalued, generating a buy signal; when the stock price is higher than the upper rail, it is at a relatively high price level and is considered overvalued, generating a sell signal.
Specifically, this strategy first calculates the 20-day moving average of closing prices as the middle rail, and then calculates twice the 20-day standard deviation of closing prices as the bandwidth. The upper rail is the middle rail + bandwidth and the lower rail is the middle rail - bandwidth. It then sets the buy condition to be closing price lower than the lower rail, and sell condition to be closing price higher than the upper rail. It generates a buy signal when closing price is below the lower rail, and a sell signal when closing price is above the upper rail.
This strategy has the following advantages:
- The principle is simple and easy to understand and implement.
- It can track market trends and automatically generate buy and sell signals.
- The risk of drawdown is relatively small with certain tracking stop-loss function.
- It can filter out false breakouts and avoid wrong operations in sideways markets.
- Parameters like period and standard deviation multiplier can be adjusted to adapt to different stocks and market environments.
There are also some risks with this strategy:
- Bollinger Bands is not a perfect indicator for buy and sell points, signals may lag.
- It cannot predict extreme market conditions, face black swan events like financial crises.
- Stock price may run on one side of the bands for long periods, resulting in insufficient signals.
- Parameter settings like period length need optimization, otherwise it may be too sensitive or inert.
Corresponding solutions:
- Combine with other indicators to confirm timing of trades
- Set stop loss and take profit to control maximum loss
- Optimize parameters to improve adaptability
- Adopt composite strategies to avoid sole reliance
The main optimization directions for this strategy includes:
- Optimize Bollinger Bands parameters like trying different period lengths and standard deviation multiplier to find the optimal fitting parameters.
- Incorporate other indicators like KDJ, MACD etc. to filter buy/sell decisions to avoid Bollinger Bands lagging issue.
- Apply machine learning algorithms to guide optimal parameter settings.
- Use deep learning to predict probability of price breaking out of bands.
- Adopt composite strategies with backup trading strategies to avoid excessive dependence on single strategy.
Overall, Bollinger Bands tracking strategy is a relatively simple and practical quantitative trading strategy. It can automatically track price trends and also provide buy and sell signals. The pros are easy implementation, smaller risks, filtering false breakouts. The cons are certain lagging, inability to face extreme market conditions like black swans. This strategy can be further enhanced through optimizing parameters and indicators, using more advanced techniques like machine learning. In summary, combining Bollinger Bands strategies with other technical strategies can form a robust and efficient quantitative trading system.
[/trans]
Strategy Arguments
| Argument | Default | Description |
|---|---|---|
| v_input_1 | 20 | Bollinger Bands Length |
| v_input_2 | 2 | Multiplier |
Source (PineScript)
/*backtest
start: 2024-01-01 00:00:00
end: 2024-01-31 23:59:59
period: 1h
basePeriod: 15m
exchanges: [{"eid":"Futures_Binance","currency":"BTC_USDT"}]
*/

//@version=5
strategy("Bollinger Bands Strategy", shorttitle="BB Strategy", overlay=true)

// Input parameters
length = input(20, title="Bollinger Bands Length")
mult = input(2, title="Multiplier")

// Calculate Bollinger Bands
basis = ta.sma(close, length)
bb_upper = basis + mult * ta.stdev(close, length)
bb_lower = basis - mult * ta.stdev(close, length)

// Buy and sell conditions
buy_condition = close < bb_lower
sell_condition = close > bb_upper

// Execute trades
strategy.entry("Buy", strategy.long, when=buy_condition)
strategy.entry("Sell", strategy.short, when=sell_condition)

// Plotting Bollinger Bands on the chart
plot(bb_upper, color=color.red, title="Upper Band")
plot(bb_lower, color=color.green, title="Lower Band")
plot(basis, color=color.blue, title="Basis")

// Highlighting buy and sell signals on the chart
bgcolor(buy_condition ? color.new(color.green, 90) : na)
bgcolor(sell_condition ? color.new(color.red, 90) : na)
Detail
https://www.fmz.com/strategy/443089
Last Modified
2024-02-29 10:51:09
