Name
基于布林带的高频交易策略Bollinger-Bands-Based-High-Frequency-Trading-Strategy
Author
ChaoZhang
Strategy Description
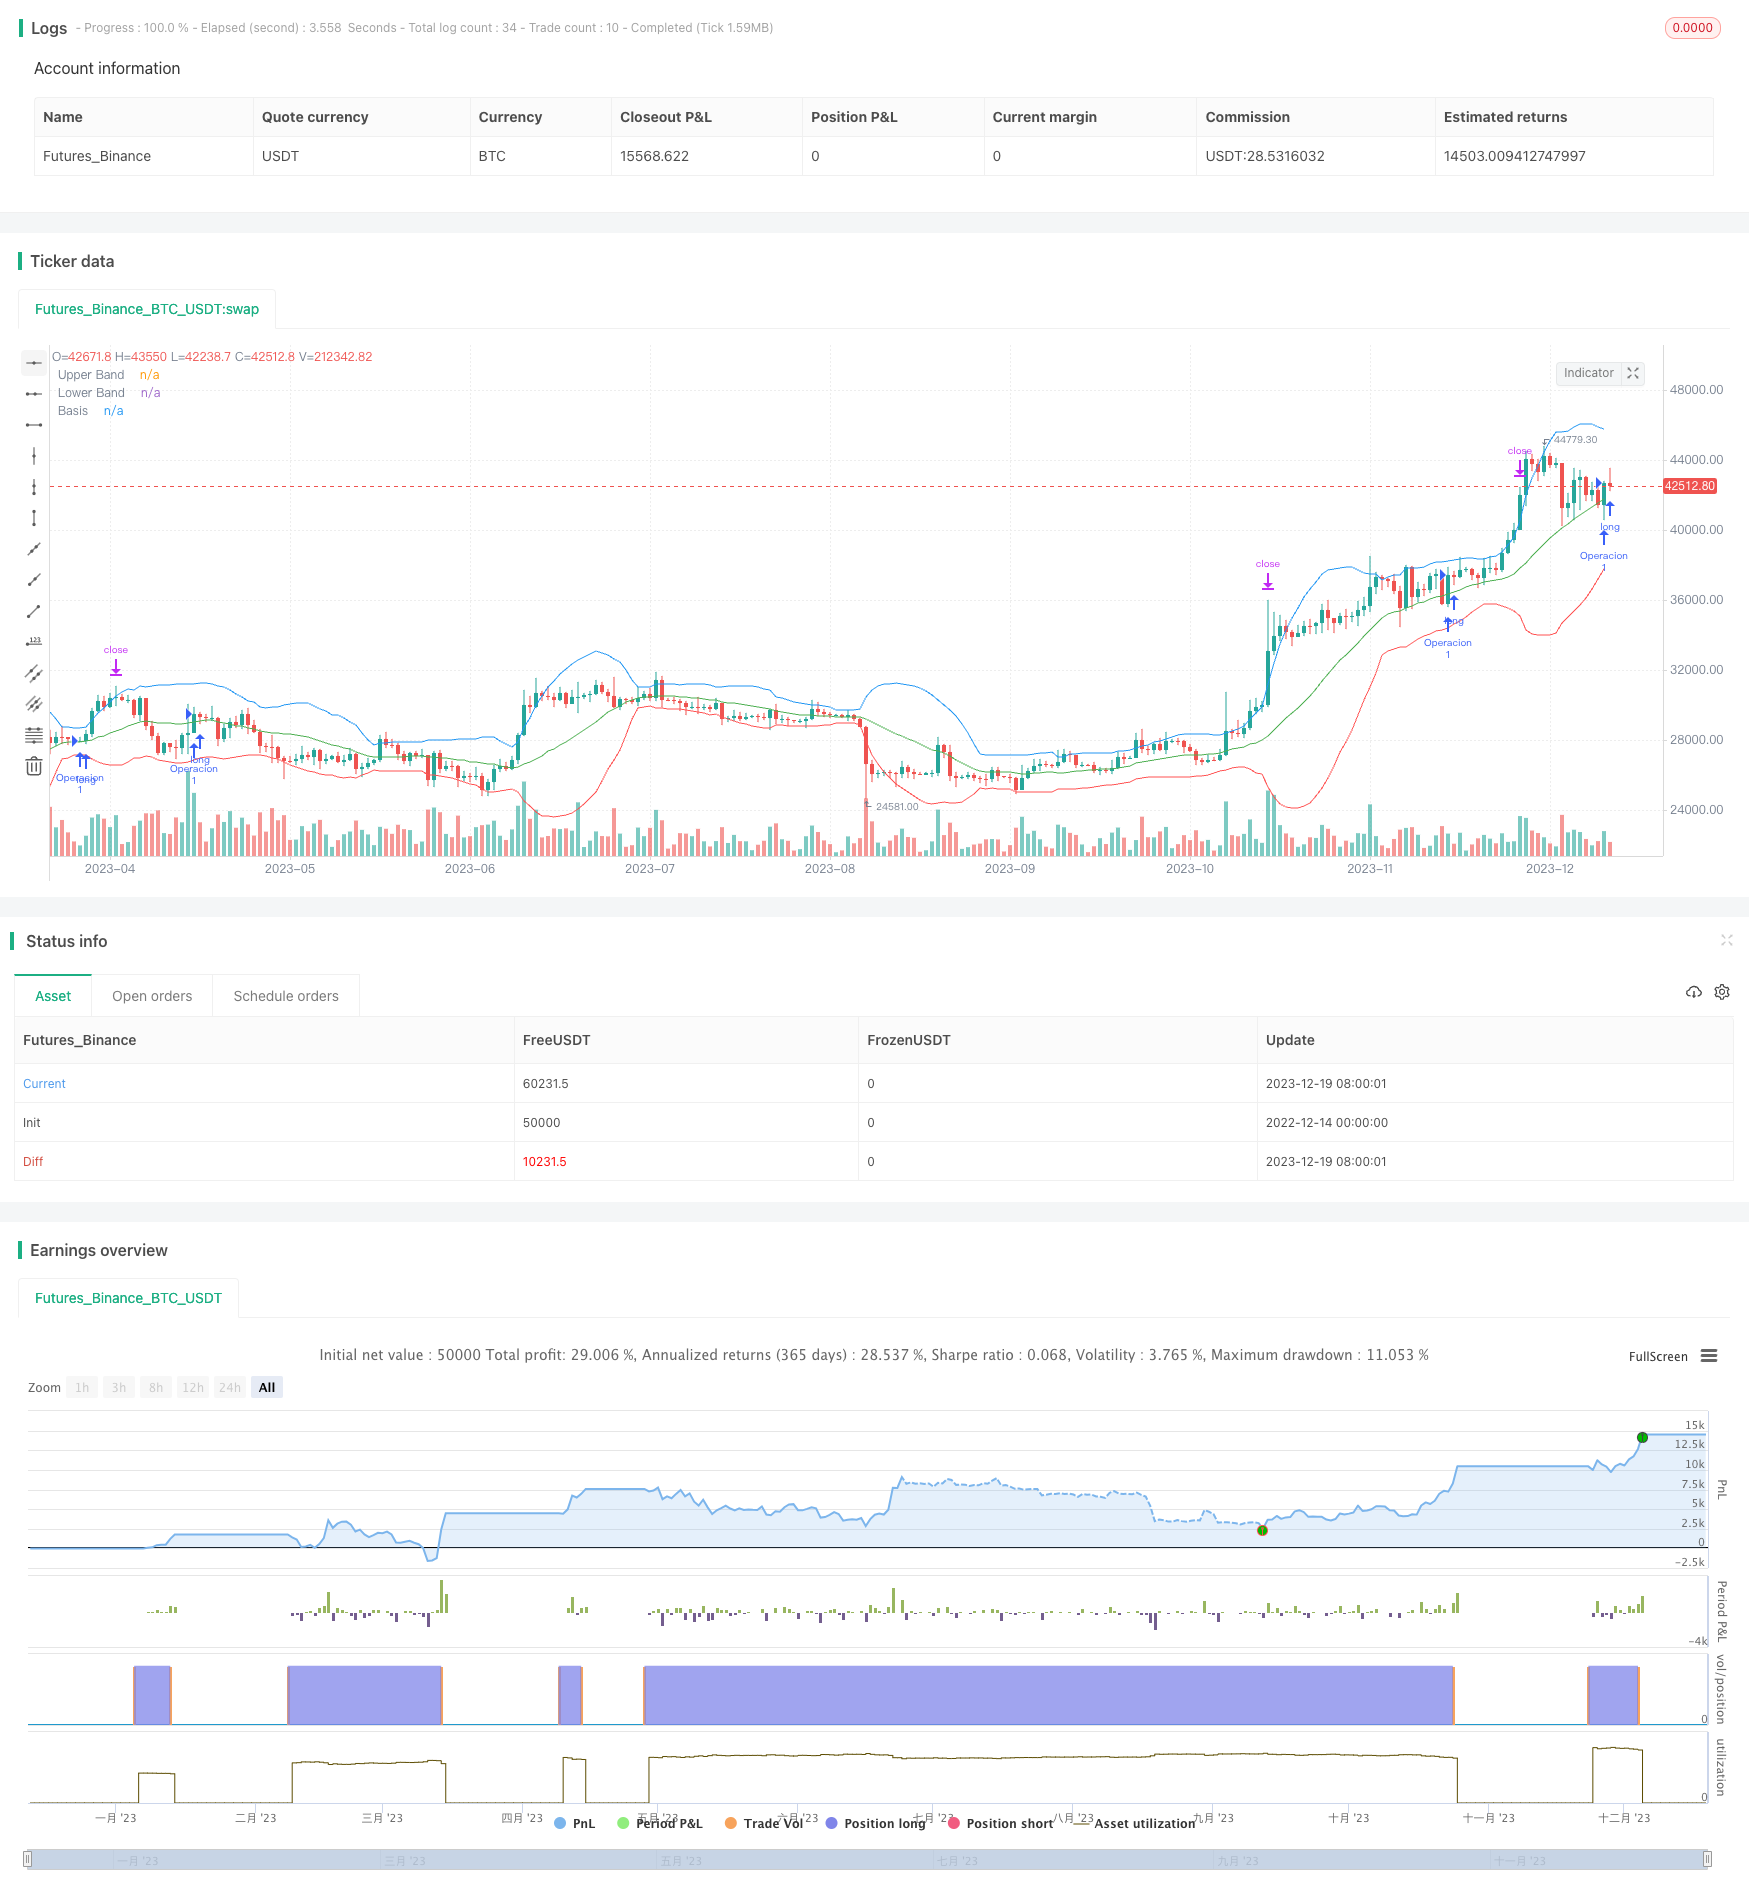
本策略基于布林带指标实现了一个高频交易策略。该策略通过计算价格的标准差和移动平均线,来确定上下布林带。当价格触及中线时,进行买入或卖出操作。每次交易固定投入全部资金,并设置0.5%的止盈范围。该策略适用于高波动性交易对和无手续费的交易所。
该策略使用布林带指标判断价格是否到达过度买入或卖出的状态。布林带由上布林带、下布林带和中线组成。中线是价格的n日简单移动平均线。上布林带是中线加上k倍的n日价格标准差。下布林带是中线减去k倍的n日价格标准差。k值一般设置为2。当价格接近上布林带时代表过度买入,当价格接近下布林带时代表过度卖出。
本策略设置布林带参数长度为20天,k值为2。当价格触及中线时,判断为价格从过度区域回归,产生交易信号。做多信号为价格上穿中线,做空信号为价格下穿中线。
每次开仓时,投入全部资金(包括本金和浮动盈亏)。然后设置0.5%的止盈范围。当价格移动超过0.5%时,平仓套利。
该策略具有如下优势:
-
使用布林带指标判断买卖点,相比简单移动平均线等指标,布林带更能判断价格的相对高低点。
-
采用高频交易策略,每个交易周期很短,可以迅速获利。
-
每次交易投入全部资金,可以最大化获利。
-
设置止盈范围来锁定利润,可以有效控制风险。
该策略也存在一些风险:
-
布林带指标对参数很敏感,如果参数设置不当,会产生大量错误信号。
-
高频交易需要无手续费的交易所,否则手续费会迅速蚕食利润。
-
全部资金交易风险大。如果遇到突发事件,可能会造成较大亏损。
-
止盈范围过小,交易次数会很多,操作频繁。
对应解决方法:
-
对布林带参数进行优化,找到最佳参数。
-
选择无手续费的交易所,例如币安现货。
-
设置止损来控制最大损失。
-
适当扩大止盈范围,减少交易次数。
该策略可以从以下方面进行优化:
-
结合交易量指标,例如能量潮指标,过滤假突破。
-
对布林带参数进行优化,找到最佳参数组合。
-
设置动态止盈止损范围。例如,随着交易次数或盈利次数的增加,逐步扩大止盈范围。
-
添加机器学习模型,利用模型预测判断买卖点。
-
结合基本面分析,在重要事件前后(如财报发布)避开交易。
本策略基于布林带构建了一个高频交易策略。使用布林带判断买卖点,全仓交易,小止盈来实现高效盈利。同时也存在一些参数敏感性、风险控制等问题。我们可以从完善指标体系、动态止损、机器学习等多方面进行优化,使策略更稳定可靠。
||
This strategy implements a high frequency trading strategy based on the Bollinger Bands indicator. It determines the upper and lower Bollinger bands by calculating the standard deviation and moving average of prices. When the price touches the middle band, long or short trades are executed. Each trade invests all capital with a 0.5% take profit range. This strategy is suitable for highly volatile trading pairs and exchanges without fees.
The strategy uses the Bollinger Bands indicator to determine if prices have reached overbought or oversold levels. The bands consist of an upper band, lower band and middle band. The middle band is a simple n-day moving average of prices. The upper band is the middle band plus k times the n-day standard deviation of prices. The lower band is the middle band minus k times the standard deviation. k is usually set to 2. When prices approach the upper band, it indicates overbuying. When prices approach the lower band, it indicates overselling.
This strategy sets the Bollinger period to 20 days and k to 2. When prices touch the middle band, it signals prices reverting from extreme areas, generating trading signals. The long signal is triggered when prices cross above the middle band. The short signal triggers when prices fall below the middle band.
When entering positions, all capital is invested (including equity and floating profit/loss). A 0.5% take profit range is then set. When prices move beyond 0.5%, positions are closed for profit.
The advantages of this strategy are:
-
Using Bollinger Bands to identify trading signals is more effective at detecting extremes than simple moving averages.
-
The high frequency approach quickly achieves profit across short trading cycles.
-
Investing all capital maximizes profit potential.
-
Setting a take profit range effectively manages risk and locks in gains.
Some risks also exist:
-
Bollinger Bands are sensitive to input parameters. Incorrect settings may produce false signals.
-
High frequency trading requires zero-fee exchanges, otherwise fees erode profits.
-
Investing all capital is risky. Black swan events could trigger big losses.
-
A tight take profit range increases trade frequency and operational complexity.
Solutions:
-
Optimize Bollinger parameters to find ideal settings.
-
Use zero-fee exchanges like Binance Spot.
-
Set stop losses to limit maximum loss.
-
Widen take profit range to reduce trade frequency.
This strategy can be improved by:
-
Adding volume indicators like On Balance Volume to filter fakeouts.
-
Optimizing Bollinger parameters to find best combinations.
-
Utilizing adaptive stop loss and take profit ranges. For example, widening ranges as trades or wins accumulate.
-
Incorporating machine learning models to predict buy/sell signals.
-
Avoiding trades around major events like earnings reports based on fundamentals.
This is a high frequency strategy using Bollinger Bands for signal generation, full position sizing and small take profits. It has advantages in profitability but also weaknesses like parameter sensitivity and risk control. Further improvements can come from enhancing indicators, adaptive stops, machine learning and more to make the strategy more robust.
[/trans]
Strategy Arguments
| Argument | Default | Description |
|---|---|---|
| v_input_1 | 20 | Longitud |
| v_input_2 | 2 | Multiplicador |
Source (PineScript)
/*backtest
start: 2022-12-14 00:00:00
end: 2023-12-20 00:00:00
period: 1d
basePeriod: 1h
exchanges: [{"eid":"Futures_Binance","currency":"BTC_USDT"}]
*/

//@version=5
strategy("Estrategia Bollinger Bands", shorttitle="BB Strategy", overlay=true)

// Parámetros de las Bandas de Bollinger
length = input(20, title="Longitud")
mult = input(2.0, title="Multiplicador")

// Calcula las Bandas de Bollinger
basis = ta.sma(close, length)
upper_band = basis + mult * ta.stdev(close, length)
lower_band = basis - mult * ta.stdev(close, length)

// Condiciones para realizar operaciones
price_touches_basis_up = ta.crossover(close, basis)
price_touches_basis_down = ta.crossunder(close, basis)

// Monto inicial de inversión
monto_inicial = 10

// Lógica de la estrategia
if (price_touches_basis_up)
    qty = strategy.equity + strategy.netprofit // Invertir el total del capital más las ganancias en cada operación
    direction = close > basis ? strategy.long : strategy.short
    strategy.entry("Operacion", direction, qty = 1)

// Lógica para cerrar la operación con un movimiento del 0.5% (take profit)
target_profit = 0.005 // Actualizado a 0.5%

if (strategy.position_size != 0)
    direction = strategy.position_size > 0 ? strategy.long : strategy.short
    strategy.exit("Take Profit/Close", from_entry = "Operacion", profit = close * (1 + target_profit))

// Dibuja las Bandas de Bollinger en el gráfico
plot(upper_band, color=color.blue, title="Upper Band")
plot(lower_band, color=color.red, title="Lower Band")
plot(basis, color=color.green, title="Basis")

// Muestra el monto inicial de inversión en la barra del título
var label lbl = label.new(na, na, "")
label.set_text(lbl, "Monto Inicial: $" + str.tostring(monto_inicial, "#.########"))
label.set_xy(lbl, bar_index, low)
label.set_color(lbl, color.new(color.blue, 0))
Detail
https://www.fmz.com/strategy/436136
Last Modified
2023-12-21 15:37:07
