Name
基于多因子组合趋势交易策略Multi-factor-Trend-Trading-Strategy
Author
ChaoZhang
Strategy Description
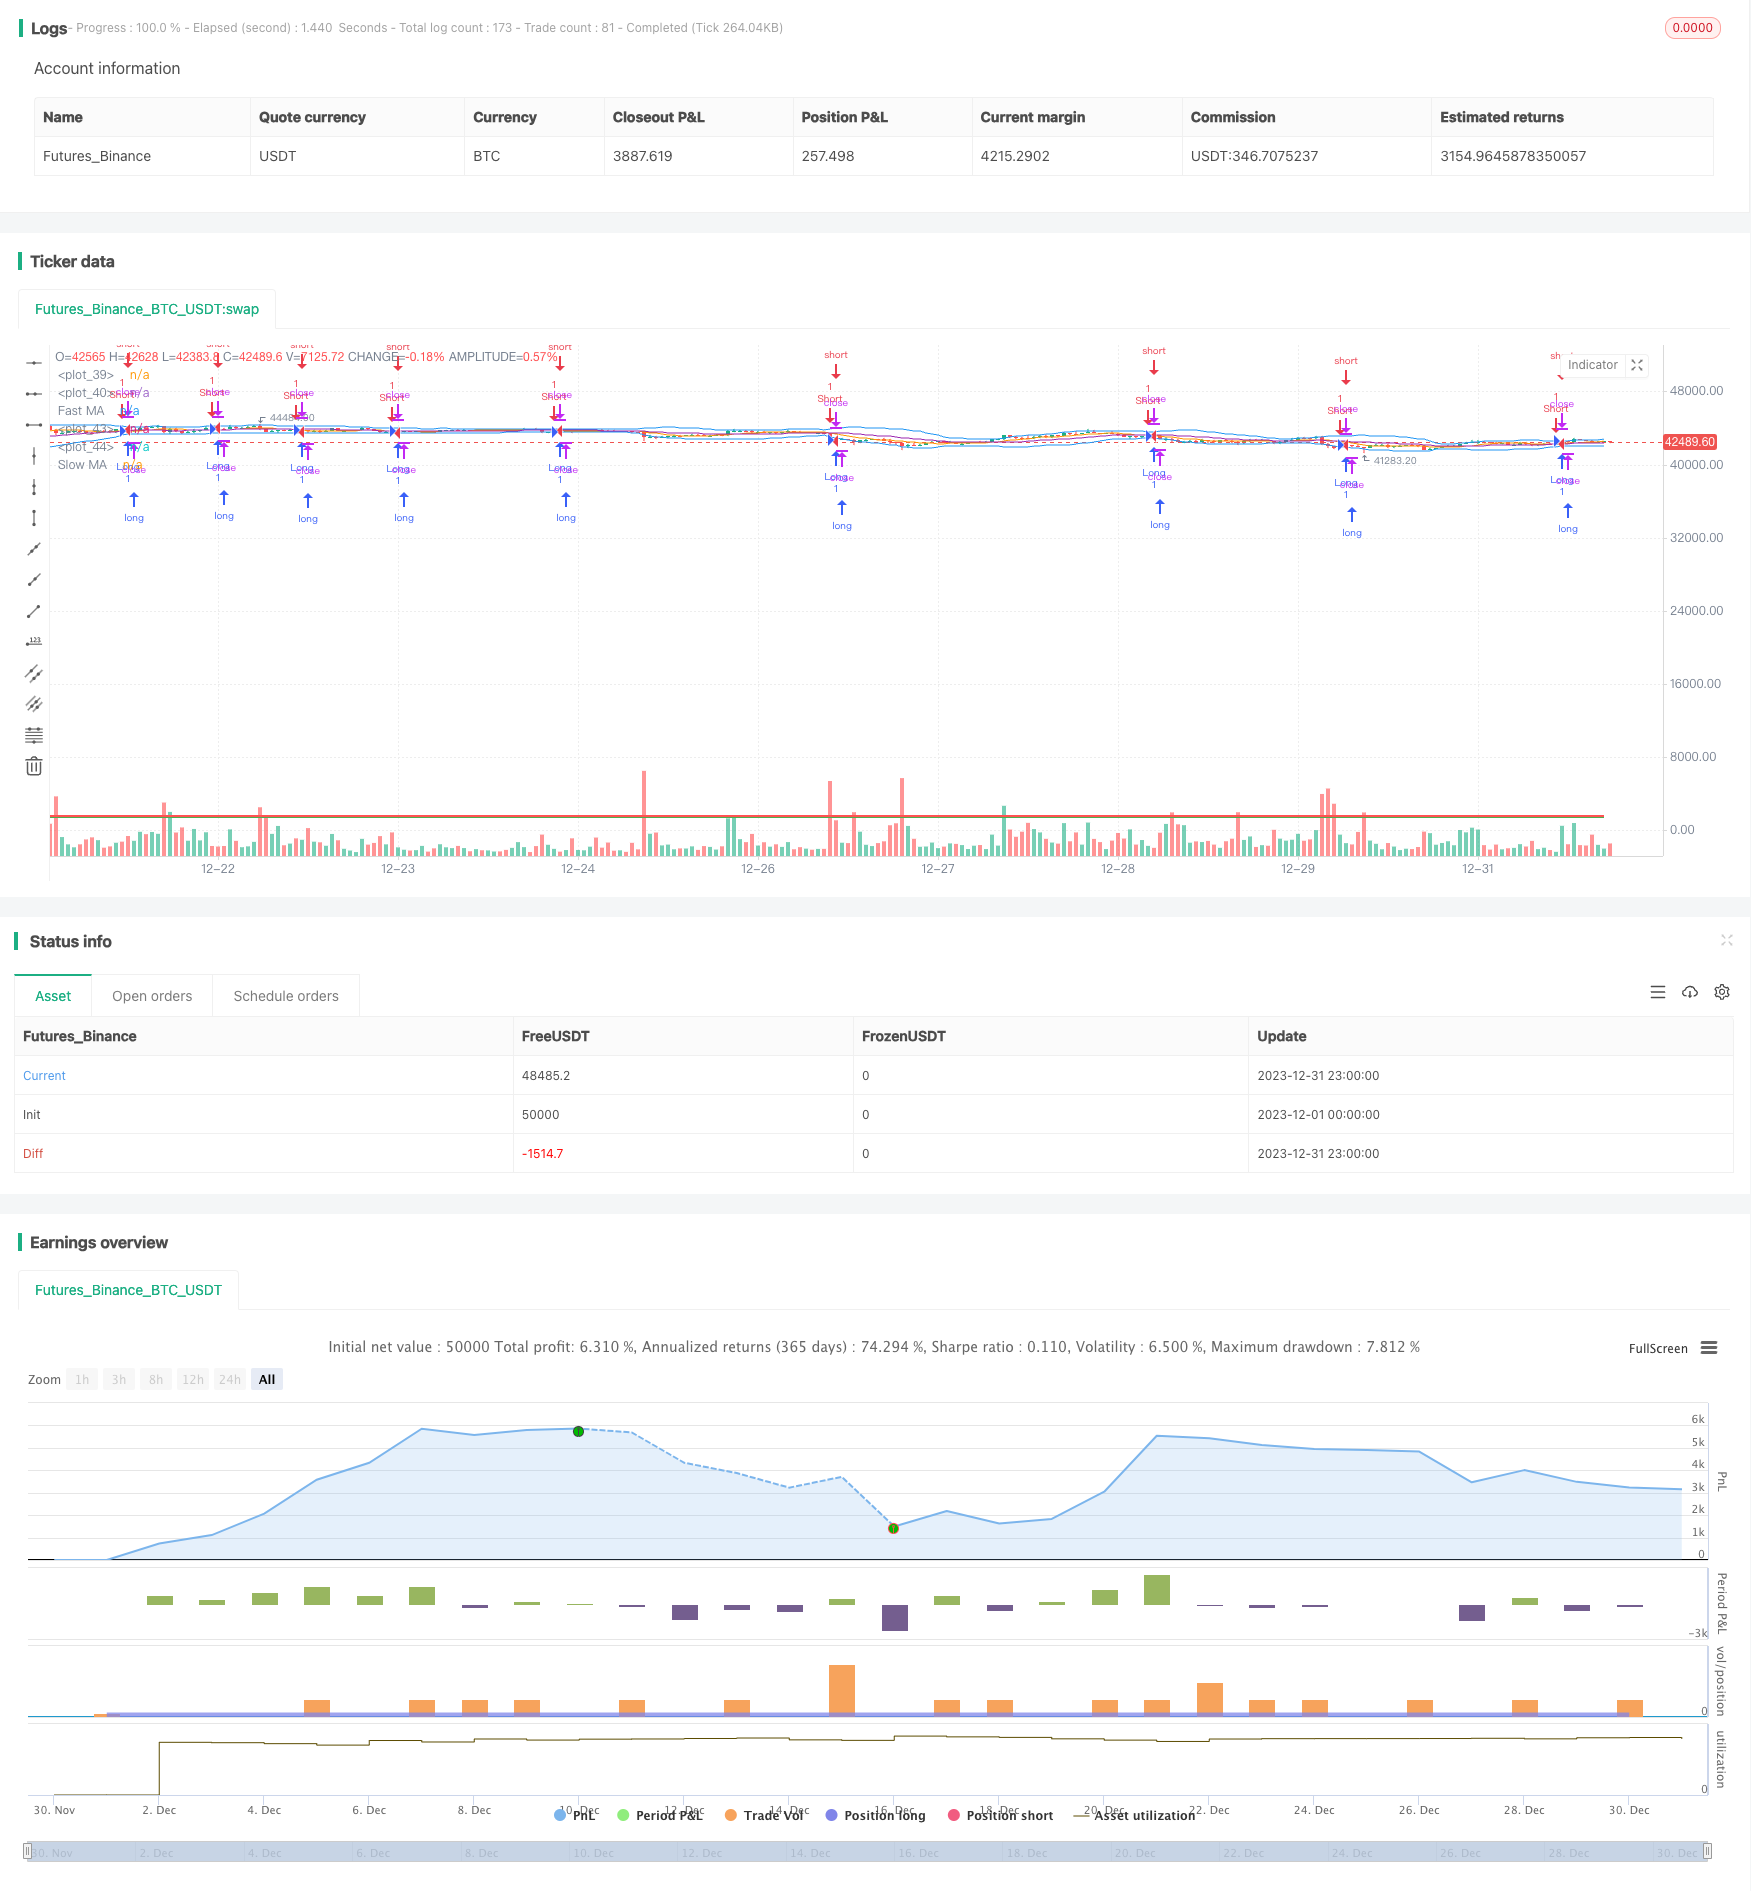
多因子组合趋势交易策略综合运用了移动平均线、波动带、支持阻力位、费波那契回撤等多种技术指标,识别股票价格趋势,进行趋势追踪交易。该策略同时结合突破交易和移动平均线金叉死叉信号,在确定股票价格趋势的同时,及时捕捉价格势头并跟风交易,以期获得超额收益。
多因子组合趋势交易策略主要基于以下几个关键要素:
-
移动平均线跟踪价格趋势。采用快速移动平均线(9日线)和慢速移动平均线(21日线)组合,当快线上穿慢线时产生买入信号,快线下穿慢线时产生卖出信号,跟踪股价趋势。
-
支持阻力位判断势头。预设支持位和阻力位,当价格突破阻力位时产生买入信号,跟踪价格向上突破;当价格跌破支持位时产生卖出信号,跟踪价格向下突破。
-
波动带识别异常波动。利用波动带上下轨判断股价是否进入盘整期,并通过突破上下轨来发现异常波动。
-
费波那契回撤确定反转点。使用费波那契回撤位判断股价在上涨过程中是否出现明显回调达到反转点。
综合这几个信号和判断规则,该策略可以有效识别股价趋势,把握买入卖出的时机点。同时结合快速移动平均线、支持阻力位和波动带的突破信号来跟踪价格势头,实现趋势交易。
多因子组合趋势交易策略具有以下优势:
-
结合多种技术指标判断股价趋势,提高准确率。
-
快速移动平均线结合支持阻力位、波段带突破增加买卖时机捕捉精确度。
-
运用费波那契回撤判断股价反转点,降低交易风险。
-
跟踪强势股价趋势,期望取得较高超额收益。
-
结合趋势和势头指标,既考量长期趋势又兼顾短期情况,收益稳定。
多因子组合趋势交易策略也存在一些风险:
-
股价产生虚假突破的概率,可能错过真正趋势或造成不必要的亏损。可以通过调整参数组合方式来降低风险。
-
复杂的多信号判断和参数设置,会使策略曲解或失效的可能性增加。需优化参数设定,提高稳定性。
-
股价长期盘整时,策略可能陷入亏损和焦虑的境地。这时应降低仓位规模,改为短线操作。
-
需充分考量个股和整体市场风险,避免流动性不足、消息面突发事件等给策略带来冲击。
多因子组合趋势交易策略还可从以下几个方面进行优化:
-
评估不同周期参数对策略效果的影响,寻找最优参数组合。例如测试5日、10日快慢均线组合的效果。
-
增加自动止损机制。当价格出现回调达到止损线时,采取止损退出以锁定利润,避免亏损扩大。
-
结合股价波动率指标,判断市场是否进入惊慌或热潮阶段,动态调整仓位。
-
增加机器学习模型预测股价趋势分类。利用算法判断买入和卖出时机,减少误判概率。
-
评估多因子权重配置对策略稳定性和超额收益的影响。优化权重分配,提高稳健性。
多因子组合趋势交易策略综合运用移动平均线、波动带、支持阻力位等多种技术分析方法判断股价趋势,策略信号判断规则组合丰富,可在一定程度上减少单一指标判断的误判风险,提高操作决策的准确性。同时,策略加入了对短期价格势头的跟踪和反转点确认机制,既顾及长期趋势又兼顾短期情况,帮助投资者顺势而为,持续盈利。但策略中参数设定和股价趋势判断都存在一定主观性,需通过大量回测和优化找到最佳参数组合,才能使策略稳定运行和获得超额收益。
||
The multi-factor trend trading strategy comprehensively utilizes various technical indicators such as moving averages, Bollinger bands, support and resistance levels, Fibonacci retracements, etc., to identify stock price trends and perform trend-following trading. The strategy combines breakout trading and moving average crossover signals to capture price momentum in a timely manner while determining stock price trends, with the aim of outperformance.
The multi-factor trend trading strategy is mainly based on the following key elements:
-
Moving averages track price trends. A combination of a fast moving average (9-day) and a slow moving average (21-day) is employed. Buy signals are generated when the fast MA crosses above the slow MA and sell signals when cross below.
-
Support and resistance levels determine momentum. Preset support and resistance levels. Buy signals are generated when the price breaks above resistance, capturing the upward breakout in price. Sell signals when break below support, tracking downward penetration.
-
Bollinger bands identify abnormal volatility. The upper and lower bands of Bollinger bands judge whether stock prices have entered a consolidation period, and discover abnormal volatility through penetration of the bands.
-
Fibonacci retracement determines reversal points. Use Fibonacci retracement levels to determine whether rising stock prices have shown significant pullback to reach reversal points.
By combining these signals and judgment rules, the strategy can effectively identify price trends and grasp the timing of entries and exits. At the same time, it incorporates breakout signals from fast moving averages, support/resistance and Bollinger bands to track price momentum and implement trend trading.
The multi-factor trend trading strategy has the following advantages:
-
Integrates multiple technical indicators to determine price trends and improve accuracy.
-
Fast MAs combined with support/resistance levels and Bollinger bands breakouts increase precision in capturing trading opportunities.
-
Applying Fibonacci retracements to determine price reversal points mitigates trading risk.
-
Tracking strong price trends is expected to achieve higher excess returns.
-
Combining trend and momentum indicators provides consideration of both long-term trends and short-term situations for steady returns.
The multi-factor trend trading strategy also carries some risks:
-
Probability of false breakouts in stock prices, which may miss true trends or cause unnecessary losses. This can be mitigated by adjusting parameter combinations.
-
Complex multi-signal judgments and parameter settings increase the possibility of model overfit or failure. Parameter tuning and optimization is needed to improve robustness.
-
Prolonged price consolidation may put the strategy at risk of losses and anxiety. In such cases, position sizing should be reduced and switch to short-term trading.
-
Individual stock risks and overall market risks should be fully considered to avoid impacts from events like insufficient liquidity and news shocks.
The multi-factor trend trading strategy can also be optimized in several aspects:
-
Evaluate the effects of different parameter cycles and find the optimal parameter combination. For example, test the 5, 10-day fast and slow MA combinations.
-
Incorporate automatic stop-loss mechanisms. Adopt stop-loss exit to lock in profits when prices pullback to stop-loss lines, avoiding enlargement of losses.
-
Incorporate volatility metrics to judge if the market has entered panic or exuberance stages, and dynamically adjust position sizing.
-
Add machine learning models for price trend prediction and classification to determine entries and exits while reducing misjudgments.
-
Evaluate effects of multi-factor weight configurations on strategy stability and excess returns. Optimize weight allocation to enhance robustness.
The multi-factor trend trading strategy utilizes a combination of technical analysis methods including moving averages, Bollinger bands, support/resistance levels etc. to determine price trends. The abundant set of signal judgment rules reduces risks of misjudgments compared to single-indicator decisions and improves decision accuracy. Additionally, mechanisms to track short-term price momentum and confirmation of reversal points take both long-term trends and short-term situations into consideration, positioning investors to trade along with trends and garner sustained profits. Nonetheless parameter settings and trend judgments contain a certain degree of subjectivity. Substantial backtests and optimizations are needed to find the optimal parameter combinations for robust and profitable operations of the strategy.
[/trans]
Source (PineScript)
/*backtest
start: 2023-12-01 00:00:00
end: 2023-12-31 23:59:59
period: 1h
basePeriod: 15m
exchanges: [{"eid":"Futures_Binance","currency":"BTC_USDT"}]
*/

//@version=4
strategy("Combined Strategy", overlay=true)

// Moving Averages
fastMA = sma(close, 9)
slowMA = sma(close, 21)

// Bollinger Bands
bb_upper = sma(close, 20) + 2 * stdev(close, 20)
bb_lower = sma(close, 20) - 2 * stdev(close, 20)

// Support and Resistance
support = 1500  // Replace with your support level
resistance = 1600  // Replace with your resistance level

// Trend Following (MA Crossovers)
maCrossUp = crossover(fastMA, slowMA)
maCrossDown = crossunder(fastMA, slowMA)

// Breakout Trading
breakoutUp = close > resistance
breakoutDown = close < support

// Entry Conditions
longCondition = maCrossUp or breakoutUp
shortCondition = maCrossDown or breakoutDown

// Exit Conditions
exitLongCondition = crossunder(close, slowMA)
exitShortCondition = crossover(close, slowMA)

strategy.entry("Long", strategy.long, when=longCondition)
strategy.entry("Short", strategy.short, when=shortCondition)

strategy.exit("ExitLong", from_entry="Long", when=exitLongCondition)
strategy.exit("ExitShort", from_entry="Short", when=exitShortCondition)

// Plotting Support and Resistance Lines
plot(support, color=color.green, style=plot.style_line, linewidth=2)
plot(resistance, color=color.red, style=plot.style_line, linewidth=2)

// Plotting Bollinger Bands
plot(bb_upper, color=color.blue)
plot(bb_lower, color=color.blue)

// Plotting Moving Averages
plot(fastMA, color=color.orange, title="Fast MA")
plot(slowMA, color=color.purple, title="Slow MA")
Detail
https://www.fmz.com/strategy/440348
Last Modified
2024-01-29 15:17:38
