Name
基于均线突破陷阱策略EMA-Breakthrough-Trap-Strategy
Author
ChaoZhang
Strategy Description
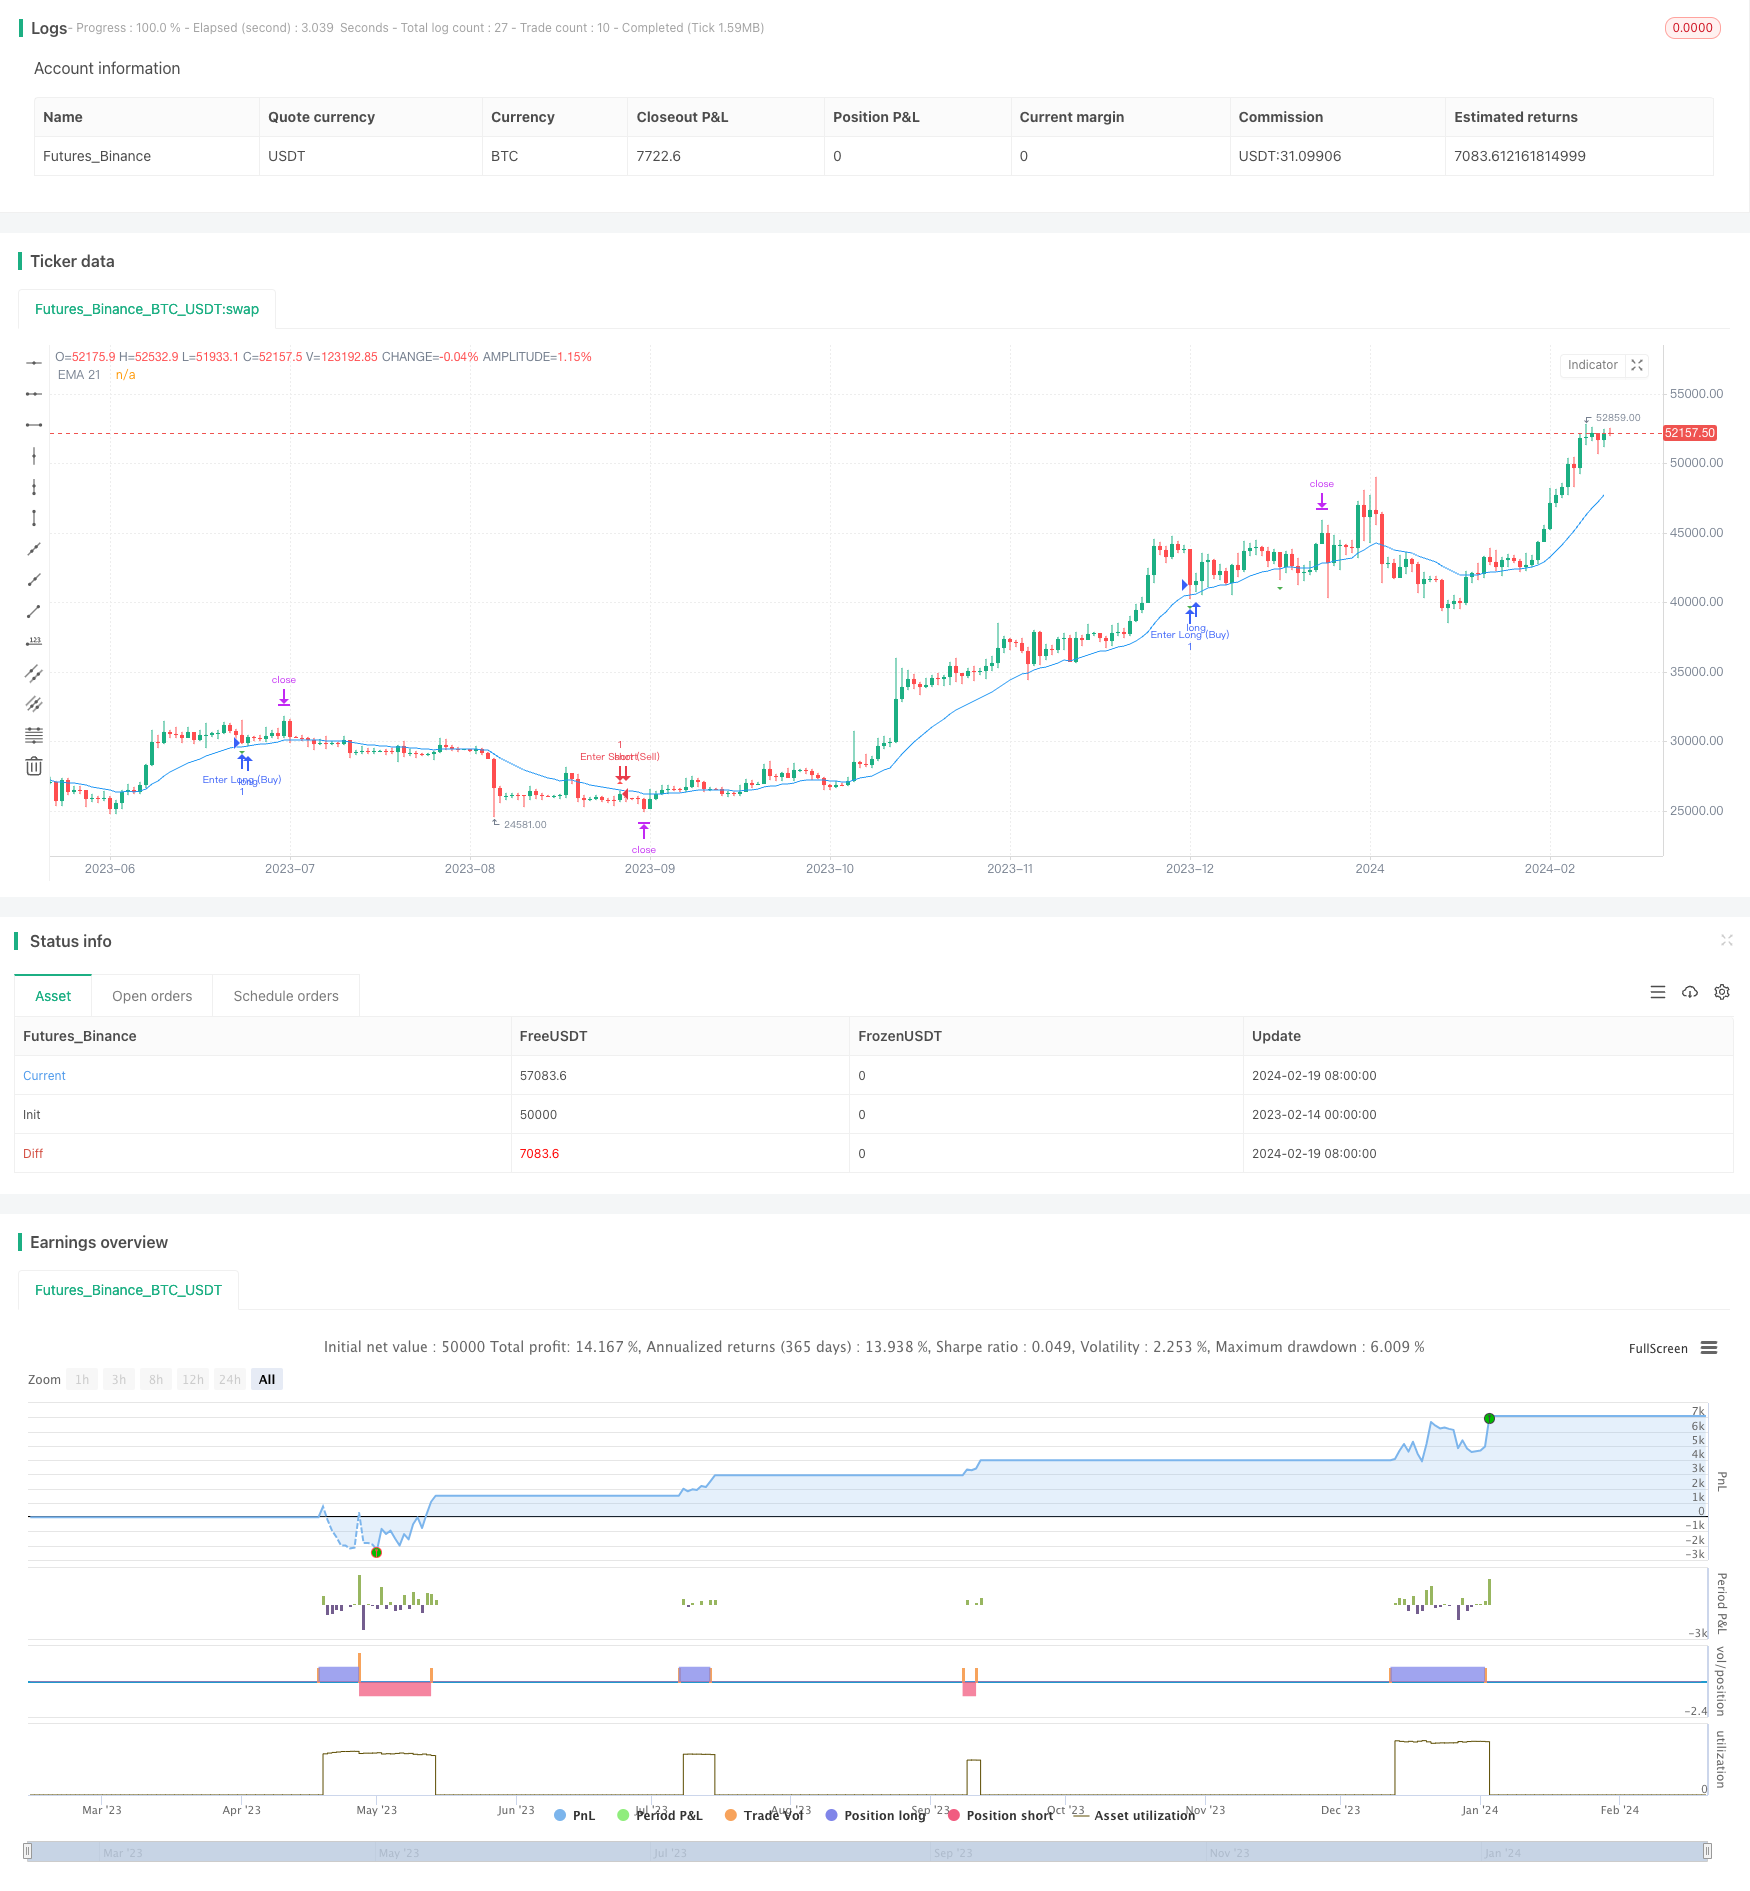
均线突破陷阱策略是一种多时间框架通用的交易工具,适用于1分钟和1小时时间框架。该策略利用21日移动平均线识别重要的市场趋势,同时运用ATR指标识别潜在的多头和空头陷阱。该策略获利率高达85%,在最佳环境下可达88%。
该策略首先计算21日指数移动平均线,以判断总体趋势和方向。然后计算最近N天的最高价和最低价(N是可调参数)。如果收盘价高于最近一日最高价,并且随后低点已跌破最近最高价与ATR指标相乘后的价位,同时收盘价已跌破21日线,则判定为多头陷阱信号。空头陷阱信号判断逻辑类似。
一旦识别出陷阱信号,就按照最近最高价与最低价之间的距离的80%设定止损止盈,进行反向操作。例如识别多头陷阱后,就做空头交易并设置止盈止损;识别空头陷阱后,做多头交易并设置止盈止损。
- 使用EMA判断趋势,可靠性高
- 借助ATR指标识别陷阱,准确率高
- 获利率高,可达85%
- 适用于多种时间框架
- 可调参数提供优化空间
- 大趋势变化时,EMA判断可能失效
- ATR参数设置不当,可能漏识陷阱
- 止盈止损位置不合理,可能减少获利或增加损失
- 高频交易时,交易成本和滑点影响
可通过优化EMA参数,调整ATR系数,动态 trailing stoploss等方法降低风险。
- 优化ATR参数和EMA周期,提高识别准确率
- 增加动态止损机制
- 结合其他指标确认信号
- 测试更多时间框架的适用性
均线突破陷阱策略整合趋势判断和陷阱识别的优点,回撤小、获利率高,适合多种交易风格,是值得推荐的高效策略。可通过参数优化和机制优化进一步增强稳定性和获利空间。
||
The EMA Breakthrough Trap Strategy is a versatile trading tool suitable for multiple timeframes including 1-minute and 1-hour charts. It utilizes the 21-day EMA to identify significant market trends, complemented by ATR-based identification of potential bull and bear traps. Notably, it achieves an impressive profitability rate averaging around 85% across different frames and peaking at 88% in optimal conditions.
The strategy first calculates the 21-day Exponential Moving Average (EMA) to judge the overall trend and direction. Then it calculates the recent N days' highest and lowest prices (N is an adjustable parameter). If the closing price is higher than the previous day's highest price, and the subsequent low point has fallen below the highest price multiplied by the ATR indicator, while the closing price has fallen below the 21-day line, a bull trap signal is determined. The judgment logic for bear trap signals is similar.
Once a trap signal is identified, set the stop loss and take profit based on 80% of the distance between the recent highest and lowest prices, and take the reverse position. For example, after identifying a bull trap signal, take a short position and set the take profit and stop loss; after identifying a bear trap signal, take a long position and set the take profit and stop loss.
- Uses EMA to judge trends, high reliability
- Leverages ATR indicator to identify traps accurately
- High profitability up to 85%
- Applicable to multiple timeframes
- Adjustable parameters provide optimization space
- EMA judgement may fail during major trend changes
- Inappropriate ATR parameter setting may miss traps
- Unreasonable stop loss/take profit placement may reduce profits or increase losses
- High trading costs and slippage impacts for high frequency trading
Risks can be reduced by optimizing EMA parameters, adjusting ATR coefficients, dynamic trailing stop loss etc.
- Optimize ATR parameters and EMA periods to improve identification accuracy
- Add dynamic stop loss mechanism
- Incorporate other indicators to confirm signals
- Test applicability across more timeframes
The EMA Breakthrough Trap Strategy integrates the advantages of trend judgment and trap identification. With low drawdowns and high profitability, it is suitable for various trading styles and is a highly efficient recommended strategy. Further enhancements in stability and profitability space can be achieved through parameter and mechanism optimization.
[/trans]
Strategy Arguments
| Argument | Default | Description |
|---|---|---|
| v_input_1 | 5 | Length |
| v_input_2 | true | ATR Multiplier |
| v_input_3 | 21 | EMA Length |
Source (PineScript)
/*backtest
start: 2023-02-14 00:00:00
end: 2024-02-20 00:00:00
period: 1d
basePeriod: 1h
exchanges: [{"eid":"Futures_Binance","currency":"BTC_USDT"}]
*/

//@version=5
strategy("Bull and Bear Trap Strategy with EMA 21 - 1min Chart", overlay=true)

// Inputs
length = input(5, "Length")
atrMultiplier = input(1.0, "ATR Multiplier")
emaLength = input(21, "EMA Length")
price = close
atr = ta.atr(length)

// EMA Calculation
ema21 = ta.ema(price, emaLength)

// Define recent high and low
recentHigh = ta.highest(high, length)
recentLow = ta.lowest(low, length)

// Bull and Bear Trap Detection
bullTrap = price > recentHigh[1] and low <= recentHigh - atr * atrMultiplier and price < ema21
bearTrap = price < recentLow[1] and high >= recentLow + atr * atrMultiplier and price > ema21

// Plotting
plotshape(series=bullTrap, title="Bull Trap", location=location.abovebar, color=color.red, style=shape.triangleup, size=size.small)
plotshape(series=bearTrap, title="Bear Trap", location=location.belowbar, color=color.green, style=shape.triangledown, size=size.small)
plot(ema21, title="EMA 21", color=color.blue)

// Measured Move Implementation
moveSize = recentHigh - recentLow
targetDistance = moveSize * 0.8 // Target at 80% of the move size

// Strategy Execution with Measured Move Targets
if (bullTrap)
    strategy.entry("Enter Short (Sell)", strategy.short)
    strategy.exit("Exit Short (Buy to Cover)", "Enter Short (Sell)", limit=price - targetDistance)

if (bearTrap)
    strategy.entry("Enter Long (Buy)", strategy.long)
    strategy.exit("Exit Long (Sell)", "Enter Long (Buy)", limit=price + targetDistance)
Detail
https://www.fmz.com/strategy/442341
Last Modified
2024-02-21 11:29:01
