Name
基于均线和超越的跟踪止损策略Moving-Average-and-Super-Trend-Tracking-Stop-Loss-Strategy
Author
ChaoZhang
Strategy Description
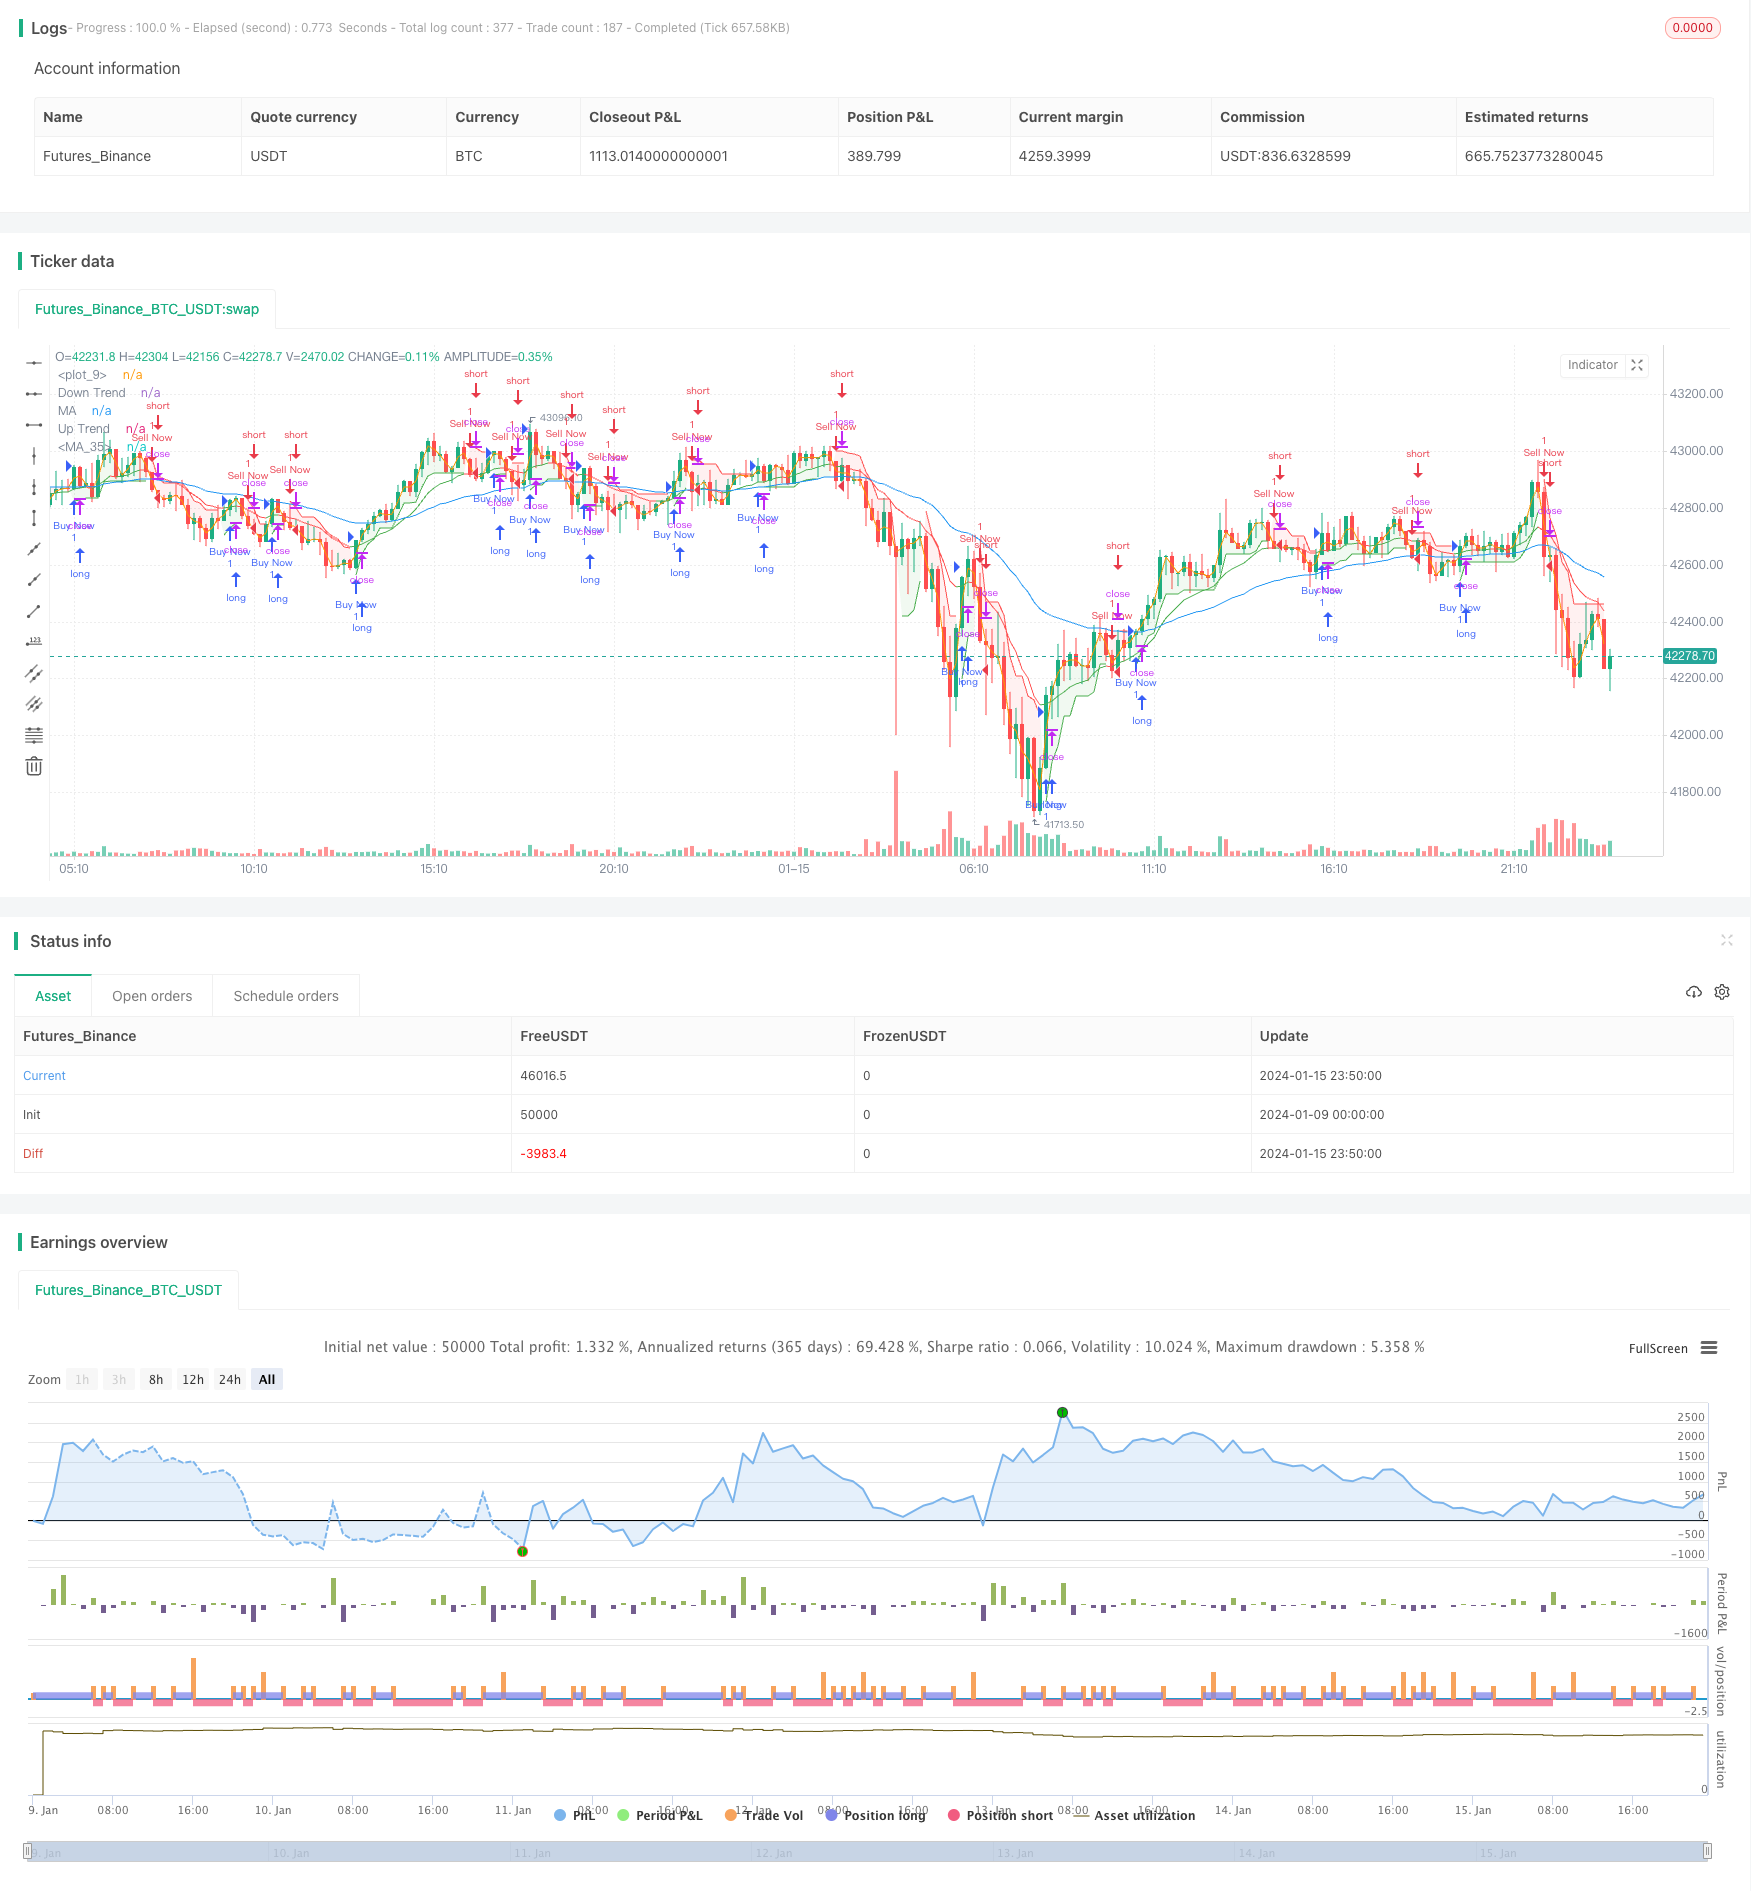
本策略利用均线和超越指标判断市场趋势,结合跟踪止损机制,设计一个跟踪止损交易策略。当超越指标判断为上升趋势时,如果收盘价上穿14周期均线,则做多;当超越指标判断为下降趋势时,如果收盘价下穿14周期均线,则做空。做多做空后,会根据止损点的位置进行止损。
本策略使用了均线、超越指标和跟踪止损三个技术指标。
首先,计算14周期和44周期的指数移动均线。其中14周期均线用于判断短期趋势,44周期均线用于判断长期趋势。当短期均线上穿长期均线时为看多信号,反之看空。
其次,计算超越指标判断当前市场趋势。超越指标由正向指标DI+和反向指标DI-组成。当DI+高于DI-时,为看多趋势;当DI-高于DI+时,为看空趋势。
最后,结合均线信号和超越指标的趋势判断,产生交易信号。当超越指标为看多,且价格上穿14周期均线时,做多;当超越指标为看空,且价格下穿14周期均线时,做空。入场后,将止损点设置为44周期均线附近,实现跟踪止损。
本策略综合利用了三种技术指标的优势,判断准确,止损及时,具有如下优势:
- 均线判断短期和长期趋势,识别信号准确。
- 超越指标判断主要趋势方向,减少错误信号。
- 跟踪止损机制,降低单笔止损,总体止损效果好。
本策略也存在一些风险:
- 突破失败风险。价格突破均线后可能再度回调,导致错过最佳入场点。
- 停损被触发风险。跟踪止损并不能完全避免亏损,只能将单笔亏损控制在一定范围。
- 参数优化风险。均线周期、超越指标参数等设置不当,会影响信号质量。
对应解决方法:
- 结合其他指标过滤信号,提高突破成功率。
- 优化跟踪止损参数,将止损点设置到合理位置。
- 对参数进行测试优化,选出最优参数组合。
本策略还可以从以下几个方向进行优化:
-
增加其他指标判断,过滤错误信号,提高策略胜率。例如结合交易量指标,强化趋势。
-
优化跟踪止损方式,让止损更加智能和灵活。例如根据ATR止损、 Chandelier Exit等。
-
利用机器学习方法寻找更优的参数。例如遗传算法、深度学习等寻找最优参数组合。
-
在更高时间框架上运行策略,避免被高频噪音干扰。
本策略综合运用均线、超越指标和跟踪止损技术,判断信号准确,止损及时,是一种务实可靠的跟踪止损交易策略。后续可通过提高信号质量、优化止损方式等进一步增强策略效果。
||
This strategy uses moving averages and the supertrend indicator to determine market trends, combined with a tracking stop loss mechanism, to design a tracking stop loss trading strategy. When the supertrend indicator judges an uptrend, if the closing price breaks through the 14-period moving average, go long; when the supertrend indicator judges a downtrend, if the closing price breaks through the 14-period moving average, go short. After going long or short, stop loss will be triggered based on the position of the stop loss point.
This strategy uses three technical indicators: moving average, supertrend and tracking stop loss.
First, calculate the 14-period and 44-period exponential moving averages. The 14-period moving average is used to determine short-term trends, while the 44-period moving average is used to determine long-term trends. When the short-term moving average crosses above the long-term moving average, it is a bullish signal, and vice versa.
Secondly, calculate the supertrend indicator to judge the current market trend. The supertrend indicator consists of the positive indicator DI+ and the negative indicator DI-. When DI+ is higher than DI-, it is a bullish trend; when DI- is higher than DI+, it is a bearish trend.
Finally, combine the moving average signal and the trend judgment of the supertrend indicator to generate trading signals. When the supertrend indicator shows bullish and the price breaks through the 14-period moving average, go long; when the supertrend indicator shows bearish and the price breaks through the 14-period moving average, go short. After entering the market, set the stop loss point near the 44-period moving average to realize tracking stop loss.
This strategy combines the advantages of three technical indicators to make accurate judgments and timely stop losses, and has the following advantages:
- Moving averages determine short-term and long-term trends, accurately identifying signals.
- The supertrend indicator determines the main trend direction and reduces false signals.
- The tracking stop loss mechanism reduces single stop loss and has an overall good stop loss effect.
This strategy also has some risks:
- Failed breakout risk. Prices may pull back again after breaking through moving averages, missing the best entry point.
- Stop loss triggered risk. Tracking stop loss cannot completely avoid losses, and can only control single losses within a certain range.
- Parameter optimization risk. Improper settings of moving average periods, supertrend parameters, etc. will affect signal quality.
The corresponding solutions are:
- Use other indicators to filter signals and improve breakout success rate.
- Optimize tracking stop loss parameters to set stop loss point to reasonable position.
- Test and optimize parameters to select the best parameter combination.
This strategy can also be optimized in the following directions:
-
Increase other indicators to filter out wrong signals and improve strategy win rate. For example, combine trading volume indicators to strengthen trends.
-
Optimize tracking stop loss methods to make stop loss more intelligent and flexible. For example, ATR stop loss, Chandelier Exit, etc.
-
Use machine learning methods to find more optimal parameters. For example, genetic algorithms, deep learning and other methods to find the optimal parameter combination.
-
Run strategies over higher time frames to avoid high frequency noise interference.
This strategy combines moving averages, supertrend indicators and tracking stop loss techniques to make accurate judgments and timely stop losses. It is a pragmatic and reliable tracking stop loss trading strategy. The effect of the strategy can be further enhanced by improving signal quality, optimizing stop loss methods, etc.
[/trans]
Strategy Arguments
| Argument | Default | Description |
|---|---|---|
| v_input_1 | 3 | ATR Length |
| v_input_float_1 | true | Factor |
| v_input_int_1 | 14 | Length |
| v_input_2_close | 0 | Source: close |
| v_input_int_2 | false | Offset |
| v_input_int_3 | 44 | Length |
Source (PineScript)
/*backtest
start: 2024-01-09 00:00:00
end: 2024-01-16 00:00:00
period: 10m
basePeriod: 1m
exchanges: [{"eid":"Futures_Binance","currency":"BTC_USDT"}]
*/

//@version=5
strategy("Santanu Strategy", overlay=true)

atrPeriod = input(3, "ATR Length")
factor = input.float(1, "Factor", step = 0.01)

[supertrend, direction] = ta.supertrend(factor, atrPeriod)

bodyMiddle = plot((open + close) / 2, display=display.none)
upTrend = plot(direction < 0 ? supertrend : na, "Up Trend", color = color.green, style=plot.style_linebr)
downTrend = plot(direction < 0? na : supertrend, "Down Trend", color = color.red, style=plot.style_linebr)

fill(bodyMiddle, upTrend, color.new(color.green, 90), fillgaps=false)
fill(bodyMiddle, downTrend, color.new(color.red, 90), fillgaps=false)

len = input.int(14, minval=1, title="Length")
src = input(close, title="Source")
offset = input.int(title="Offset", defval=0, minval=-500, maxval=500)
out = ta.ema(src, len)

len44 = input.int(44, minval=1, title="Length")
out44 = ta.ema(src, len44)

isRising = ta.rising(out, 1)
isFalling = ta.falling(out, 1)

plotColor = color.black
if isRising
    plotColor := color.green
else if isFalling
    plotColor := color.red


plot(out, color=plotColor, title="MA", offset=offset)
plot(out44, color=color.blue, title="MA", offset=offset)

if direction < 0
    if close >= out
        //if low >= out44
        if isRising
            strategy.entry("Buy Now", strategy.long)

if direction > 0
    if close <= out
        //if high <= out44
        if isFalling
            strategy.entry("Sell Now", strategy.short)


//plot(strategy.equity, title="equity", color=color.red, linewidth=2, style=plot.style_areabr)
Detail
https://www.fmz.com/strategy/439048
Last Modified
2024-01-17 11:46:01
