Name
基于反转趋势追踪策略Reversal-Tracking-Strategy
Author
ChaoZhang
Strategy Description
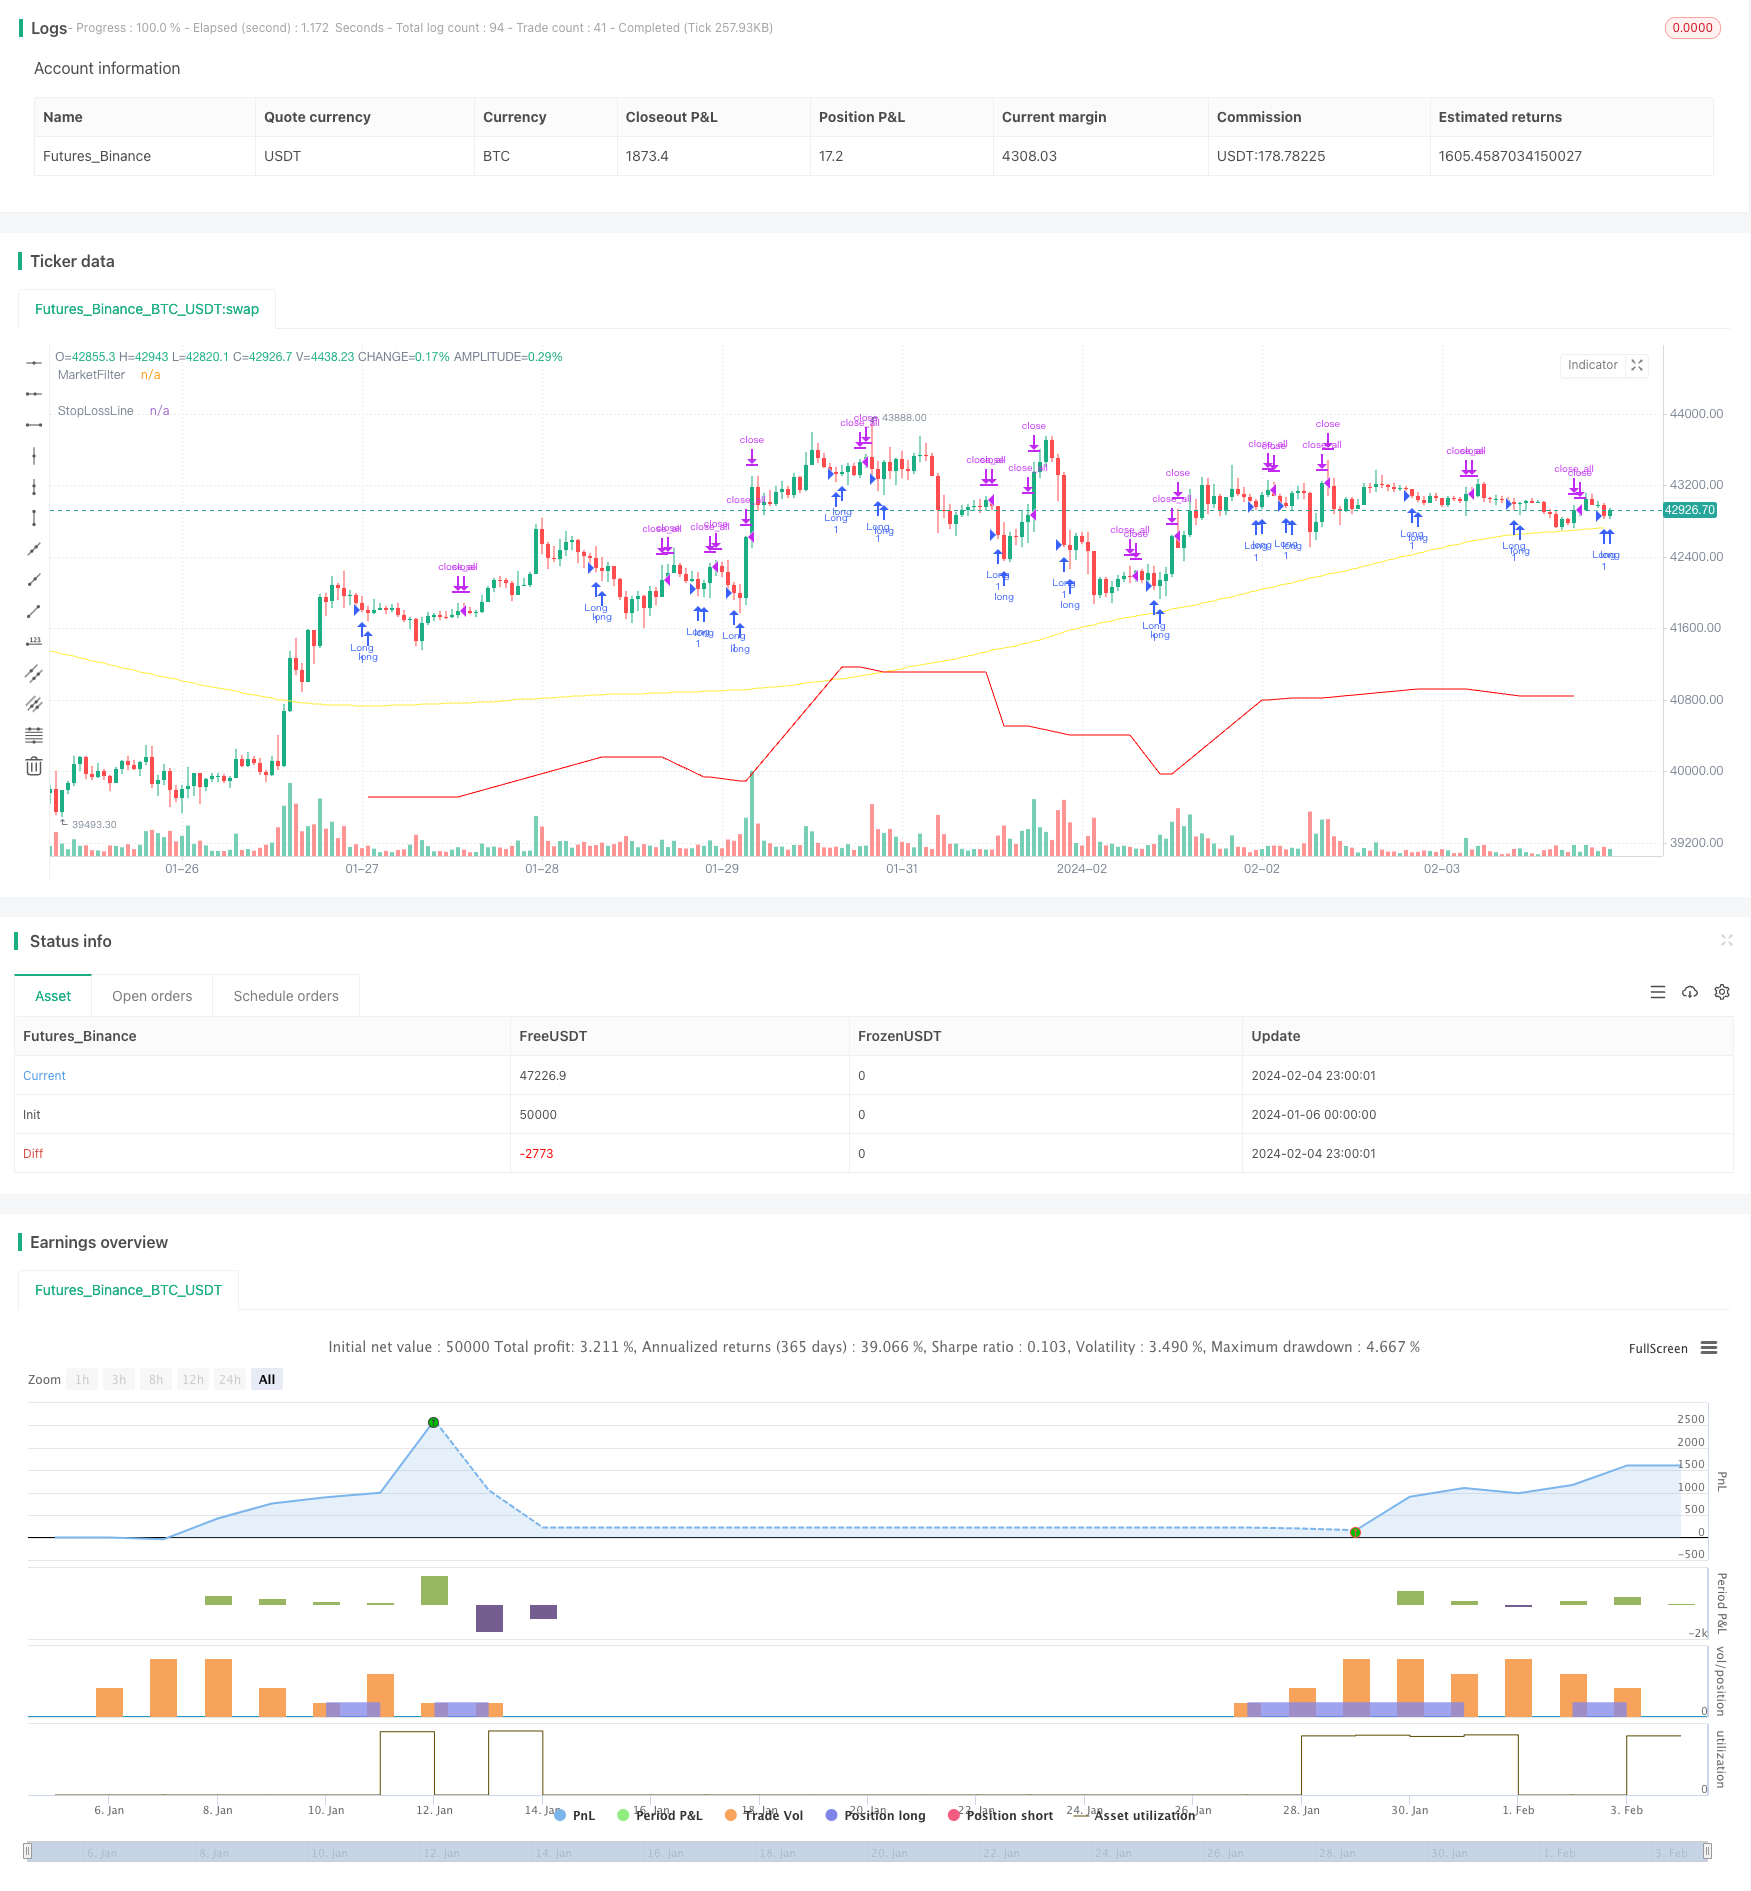
反转追踪策略是一种趋势追踪策略,它结合移动平均线作为市场过滤器,在股价出现反转信号时建立仓位,实现低买高卖,追踪股价反转后的趋势,获得超额收益。
该策略的核心逻辑是:当收盘价低于N天前的低点时建立做多仓位;当收盘价高于N天前的高点时平掉做多仓位。同时,它结合了200天简单移动平均线作为市场滤波器——只有当价格高于200天移动平均线时才会建立做多仓位。
该策略基于价格反转理论,认为股价的趋势会反复出现高点和低点。当价格跌破N天前形成的低点时,是建立做多仓位的时机点;当价格涨破N天前的高点时,说明反转利好已经消退,是平仓止盈的时机点。
具体来说,该策略有以下核心模块:
-
市场滤波器
使用200天简单移动平均线作为市场趋势的判断指标。只有当股价高于200天线时,才允许建仓。这可以避免在牛市中建立做空仓位,或者在熊市中建立做多仓位。
-
反转信号判断
判断逻辑:收盘价 < N天前的最低价
收盘价低于N天前(默认5天)的最低价,表明股价出现下跌突破,启动买入信号。
-
止盈信号判断
判断逻辑:收盘价 > N天前的最高价
收盘价高于N天前(默认5天)的最高价,表明股价反转行情已经结束,启动止盈信号。
-
5% 止损
从入市价位开始,设置5%的止损线,避免损失过大。
该策略具有以下主要优势:
- 采用价格反转理论,可以在股价反转开始阶段建立仓位,追踪后续趋势。
- 结合移动平均线作为市场滤波器,避免建立不适宜的做多或做空仓位,减少套牢风险。
- 采用N天前的最高价和最低价判断反转信号,参数灵活,可以根据市场调整N的值。
- 设置5%的止损幅度,可以快速止损,避免单笔损失过大。
- 实现了低买高卖,追踪股价反转带来的超额收益。
该策略也存在一些风险:
- 股价反转信号可能是假突破,无法启动真正的趋势反转,从而导致亏损。
- N天参数设置不当,可能错过真正的反转时点或提前止损。
- 止损幅度设置太大,单笔亏损可能过大;止损幅度太小,可能过早止损。
- 该策略更适合作用在股指和一些已确立上涨趋势的个股,不适合全部股票池的橡皮球交易。
该策略可以从以下几个方面进行优化:
- 优化移动平均线的参数,测试不同天数参数的效果。
- 测试调整反转信号判断的N参数,寻找最优参数组合。
- 优化止损幅度参数,平衡止损与持仓时间。
- 添加动量指标等过滤器,确保交易信号更加可靠。
- 针对不同的交易品种设定独立的参数组合进行回测优化。
反转追踪策略结合移动平均线指标,在确定市场环境后,通过反转理论选择买入时机;止盈止损机制控制风险,实现低买高卖,获取超额收益。该策略可以通过参数优化、添加辅助过滤器等手段进行改进,在趋势行情中获得较好收益。
||
The Reversal Tracking strategy is a trend tracking strategy that combines moving averages as market filters. It establishes positions when price reversal signals occur to implement buy low and sell high, tracking the trend after price reversals to gain excess returns.
The core logic of this strategy is: establishing long positions when the close is lower than the low N days ago; closing long positions when the close is higher than the high N days ago. It also combines the 200-day simple moving average as a market filter - long positions are only established when prices are above the 200-day moving average.
This strategy is based on price reversal theory, which believes that trends in stock prices will repeatedly show highs and lows. When prices break below the low formed N days ago, it is time to establish long positions; when prices break above the high N days ago, it indicates that the reversal uptrend has ended and it is time to take profits.
Specifically, the core modules of this strategy are:
-
Market Filter
Use the 200-day simple moving average to judge market trends. Allow establishing positions only when stock prices are above the 200-day line. This avoids establishing short positions in a bull market or establishing long positions in a bear market.
-
Reversal Signal Judgement
Logic: Close < Lowest price N days ago
If the close is lower than the lowest price N days ago (default 5 days), it indicates a downside price breakdown and triggers a buy signal.
-
Take Profit Signal Judgement
Logic: Close > Highest price N days ago
If the close is higher than the highest price N days ago (default 5 days), it indicates the reversal uptrend has ended and triggers a take profit signal.
-
5% Stop Loss
Set a 5% stop loss line from the entry price to avoid excessive losses.
The main advantages of this strategy are:
- Adopting price reversal theory allows establishing positions at the beginning of price reversals and tracking subsequent trends.
- Combining moving averages as market filters avoids establishing inappropriate long or short positions, reducing the risk of being trapped in wrong positions.
- Using the highest and lowest prices N days ago to determine reversal signals provides flexible parameters that can be adjusted based on market conditions.
- The 5% stop loss can quickly cut losses and avoid excessive losses per trade.
- Achieve buying low and selling high by tracking excess returns from price reversal trends.
There are also some risks with this strategy:
- Price reversal signals could be false breakouts, unable to initiate real trend reversals, thus leading to losses.
- Inappropriate N day parameter settings may miss real reversal points or trigger premature stop losses.
- If the stop loss percentage is too high, single trade losses may be too large; if too small, stop losses may be triggered prematurely.
- This strategy is more suitable for indexes and some uptrend stocks, not ideal for mean reversion trading on the overall stock universe.
The strategy can be optimized in the following aspects:
- Optimize moving average parameters to test the effects of different day inputs.
- Test adjusting the N parameter for reversal signal judgment to find optimal parameter combinations.
- Optimize the stop loss percentage to balance between stop losses and holding time.
- Add momentum indicators and other filters to ensure more reliable trading signals.
- Set independent parameter combinations for different trading products and optimize via backtesting.
The Reversal Tracking Strategy combines moving average indicators to determine market conditions and utilizes reversal theory to select entry timing. The risk control mechanisms of take profit and stop loss target excess returns by buying low and selling high. The strategy can be improved through parameter optimization, adding auxiliary filters, etc. It can achieve good returns in trending markets.
[/trans]
Strategy Arguments
| Argument | Default | Description |
|---|---|---|
| v_input_1 | 0.95 | StopLoss |
| v_input_2 | 5 | HowManyBars |
Source (PineScript)
/*backtest
start: 2024-01-06 00:00:00
end: 2024-02-05 00:00:00
period: 1h
basePeriod: 15m
exchanges: [{"eid":"Futures_Binance","currency":"BTC_USDT"}]
*/

//  @version=4
//  © HermanBrummer
//  This source code is subject to the terms of the Mozilla Public License 2.0 at https://mozilla.org/MPL/2.0/

//  BUYS    WHEN THE CLOSE IS SMALLER THAN THE LOW OF 5 DAYS AGO
//  SELLS   WHEN THE CLOSE IS HIGHER THEN THE HIGH OF 5 DAYS AGO
//  USES A 200 MOVING AVERGE AS A FILTER, AND DOESN'T TAKE TRADES IF THE MARKET IS BELOW IT'S 200 MA
//  USES A 5% STOP LOSS FROM ENTRIES

strategy("REVERSALS", overlay=true)

StopLoss    = input(.95, step=0.01)
HowManyBars = input( 5 )

///     EXITS
if  close > sma(high,HowManyBars)[1]
    strategy.close_all()


///     ENTRIES
MarketFilter    = sma(close, 200)
F1              = close < sma(low,HowManyBars)[1]
F2              = close > MarketFilter
plot(MarketFilter, "MarketFilter", color.yellow)

strategy.entry("Long", true, 1, when=F1 and F2)


///     STOP LOSS
StopLossLine    = strategy.position_avg_price * StopLoss
plot(StopLossLine, "StopLossLine", #FF0000)
strategy.exit("Exit", stop=StopLossLine)
Detail
https://www.fmz.com/strategy/441142
Last Modified
2024-02-06 10:03:40
