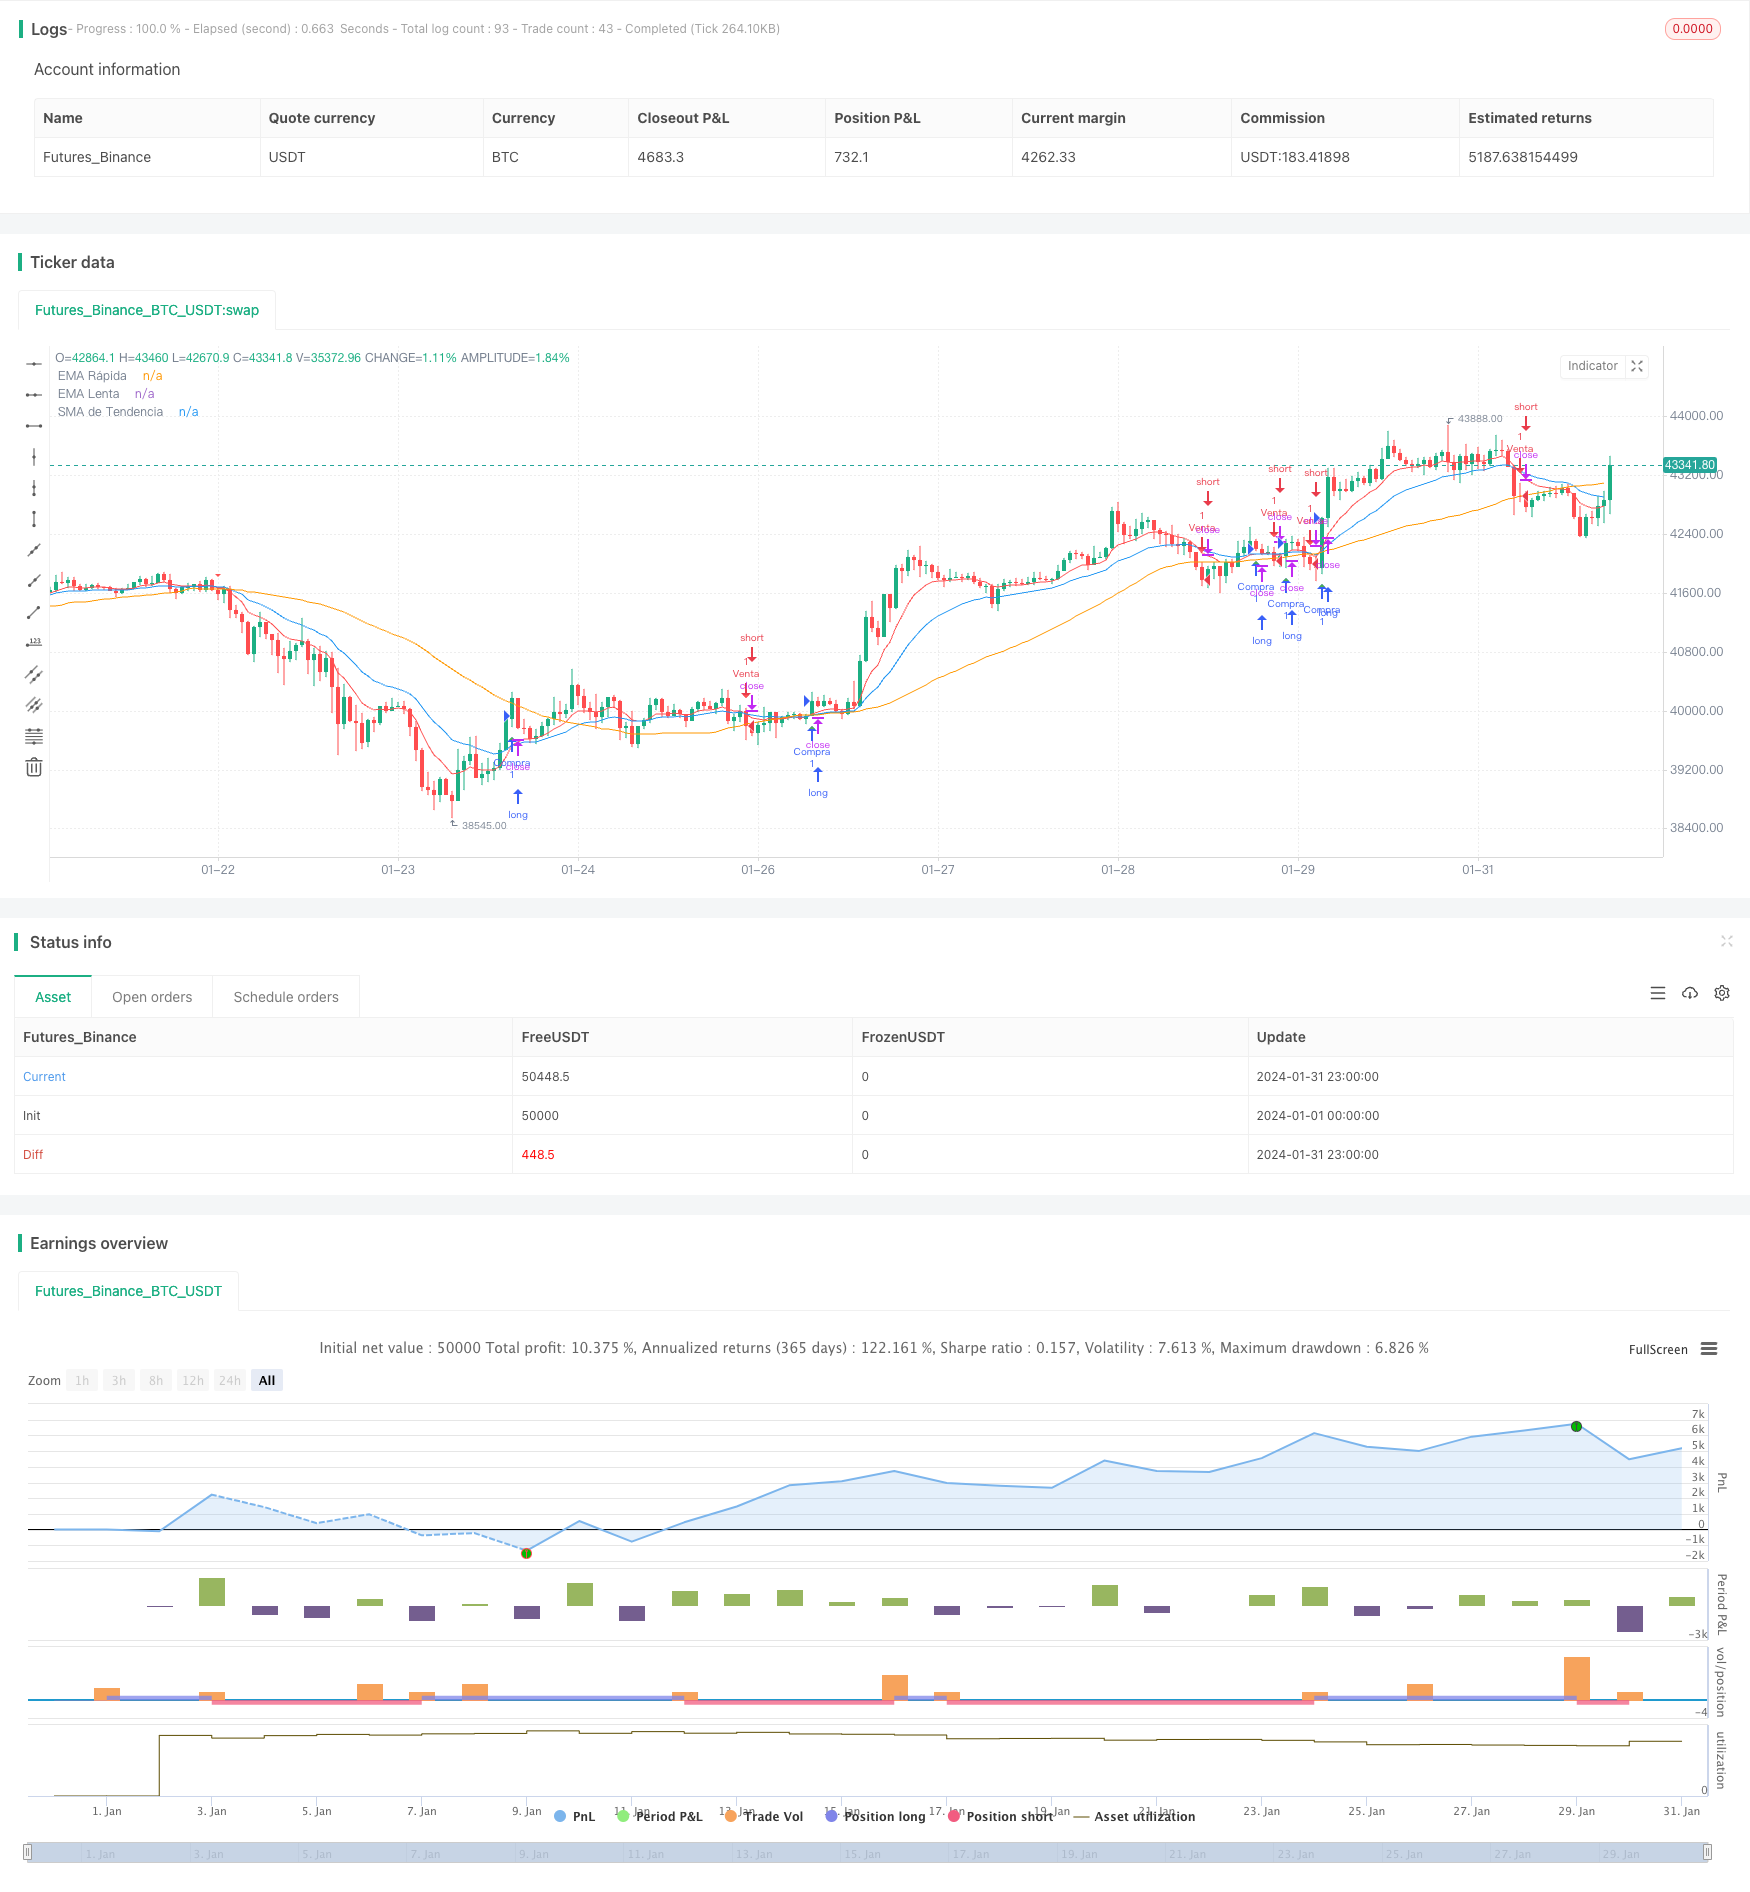
Name
基于动量突破EMA交叉策略Momentum-Breakout-EMA-Crossover-Strategy
Author
ChaoZhang
Strategy Description
动量突破EMA交叉策略充分利用动量指标与移动平均线的交叉信号,识别股价中的趋势与反转机会。该策略采用快速EMA线与慢速EMA线的金叉与死叉,判断市场潜在的多头与空头机会。此外,该策略还引入中长线趋势判断指标——中轨SMA指标,对原有EMA交叉信号进行过滤,以确保仅在市场总体趋势方向一致时,才产生交易信号。
该策略主要由三部分组成:
-
快速EMA线(9日线)与慢速EMA线(21日线)的交叉运算。EMA交叉金叉为买入信号,死叉为卖出信号。该部分利用EMA指标对股价的趋势性与反转性进行判断。
-
中长线趋势判断指标:50日SMA指标。该指标反映了中长线的价格走势,可用来识别总体趋势的方向。
-
动量指标:以收盘价与SMA中轨的比较,作为决定是否发出交易信号的动量过滤条件。仅在收盘价突破中轨方向时,才产生实际的交易信号。
在具体实施时,该策略以9日EMA与21日EMA的交叉作为基本判断buy/sell的输入信号。而后在该信号发出时,再检验收盘价是否突破50日SMA中轨,以判断总体趋势的方向。仅当基本交易信号与总体趋势方向一致的时候,才会最终产生实际的买入与卖出信号,并对应建立看多或看空的头寸。
-
能有效识别股价中的趋势性机会,捕捉中长线精确的涨跌方向。
-
借助动量指标有效过滤掉部分噪音与反转信号,减少不必要的头寸打开与关闭。
-
EMA交叉与SMA过滤器的配合使用,可产生比较理想的稳定盈利模式。
-
在震荡格局中,EMA交叉信号可能过于频繁,造成频繁交易与滑点损耗。
-
SMA中轨指标的参数设定可能不当,未能有效确认中长线趋势。
-
EMA与SMA参数选择不当,响应速度与稳定性失衡,可能出现平滑后的延迟。
-
优化参数,寻找最佳的参数组合;
-
增加其他指标验证信号,确保交易信号的质量;
-
适当调整仓位管理,控制单次交易风险。
-
测试更多参数组合,寻找最优参数;
-
增加价格突破,成交量等条件来确定趋势;
-
尝试不同的MA指标,如KDJ,MACD等判断潜在趋势;
-
优化仓位管理方式,通过风险管理进一步控制回撤。
动量突破EMA交叉策略中,EMA交叉为基础信号,SMA中轨与价格关系的比较作为确认过滤器。这种思路充分利用指标联合使用的优势,提高了信号质量。有效解决了单一使用EMA时,出现过多反转信号的问题。该策略较好地平衡了捕捉趋势性机会与识别反转机会,实现了盈利模式的优化。未来可从参数选择与组合、仓位管理等方面进行深入优化。
||
The momentum breakout EMA crossover strategy makes full use of the crossover signals between momentum indicators and moving averages to identify trend and reversal opportunities in stock prices. This strategy adopts the golden cross and death cross of the fast EMA line and slow EMA line to determine potential bullish and bearish opportunities in the market. In addition, this strategy also introduces the medium and long-term trend judgment indicator - the middle rail SMA indicator to filter the original EMA crossover signals to ensure that trading signals are generated only when the overall market trend direction is consistent.
The strategy consists of three main parts:
-
Crossover operation of fast EMA line (9-day line) and slow EMA line (21-day line). The golden cross of EMA is a buy signal and the death cross is a sell signal. This part uses the EMA indicator to judge the trend and reversal of stock prices.
-
Medium and long term trend judgment indicator: 50-day SMA indicator. This indicator reflects the medium and long term price movement and can be used to identify the overall trend direction.
-
Momentum indicators: compare the closing price with the SMA middle rail to determine whether to issue a transaction signal as a momentum filtering condition. Trading signals are generated only when the closing price breaks through the middle rail in direction.
In implementation, this strategy takes the crossover of 9-day EMA and 21-day EMA as the basic judgment of buy/sell input signals. After that, when the signal is issued, check whether the closing price breaks through the 50-day SMA middle rail to determine the overall trend direction. Only when the basic trading signal is consistent with the overall trend direction, the actual buying and selling signals will be finally generated, and corresponding long or short positions will be established.
-
Can effectively identify trend opportunities in stock prices and capture accurate ups and downs in the medium and long term.
-
With the help of momentum indicators, some noise and reversal signals can be effectively filtered to reduce unnecessary opening and closing of positions.
-
The combination of EMA crossover and SMA filter can produce a relatively ideal steady profit model.
-
In a shock pattern, EMA crossover signals may be too frequent, resulting in frequent trading and slippage losses.
-
The parameter setting of the SMA middle rail indicator may be improper and fail to effectively confirm the medium-term trend.
-
Improper selection of EMA and SMA parameters may result in delayed smoothing.
-
Optimize parameters to find the best parameter combination;
-
Increase other indicators to verify signals and ensure signal quality;
-
Properly adjust position management to control single transaction risk.
-
Test more parameter combinations to find the optimal parameters;
-
Increase price breakthrough, volume and other conditions to determine the trend;
-
Try different MA indicators such as KDJ, MACD to judge potential trends;
-
Optimize position management methods to further control drawdowns through risk management.
In the momentum breakout EMA crossover strategy, EMA crossover is the basis signal, and the comparison between the SMA middle rail and the price relationship serves as a confirmation filter. This idea takes full advantage of the benefits of combined use of indicators to improve signal quality. It effectively solves the problem of too many reversal signals that occur when EMAs are used alone. The strategy strikes a good balance between capturing trend opportunities and identifying reversal opportunities, achieving optimization of the profit model. Further in-depth optimization can be done in areas such as parameter selection and portfolio and position management.
[/trans]
Strategy Arguments
| Argument | Default | Description |
|---|---|---|
| v_input_1 | 9 | Longitud EMA Rápida |
| v_input_2 | 21 | Longitud EMA Lenta |
Source (PineScript)
/*backtest
start: 2024-01-01 00:00:00
end: 2024-01-31 23:59:59
period: 1h
basePeriod: 15m
exchanges: [{"eid":"Futures_Binance","currency":"BTC_USDT"}]
*/

//@version=5
strategy("Estrategia EMA Cruzada con Filtro de Tendencia", overlay=true)

// Configuración de EMAs
fastLength = input(9, title="Longitud EMA Rápida")
slowLength = input(21, title="Longitud EMA Lenta")
emaFast = ta.ema(close, fastLength)
emaSlow = ta.ema(close, slowLength)

// Configuración del filtro de tendencia
trendSMA = ta.sma(close, 50)

// Condiciones de entrada mejoradas con filtro de tendencia
longCondition = ta.crossover(emaFast, emaSlow) and close > trendSMA
shortCondition = ta.crossunder(emaFast, emaSlow) and close < trendSMA

// Ejecutar entradas y salidas
if (longCondition)
    strategy.entry("Compra", strategy.long)
if (shortCondition)
    strategy.entry("Venta", strategy.short)

// Dibujar EMAs y SMA en el gráfico
plot(emaFast, color=color.red, title="EMA Rápida")
plot(emaSlow, color=color.blue, title="EMA Lenta")
plot(trendSMA, color=color.orange, title="SMA de Tendencia")

// Indicadores visuales para las señales de compra y venta
plotshape(series=longCondition, title="Señal de Compra", location=location.belowbar, color=color.green, style=shape.triangleup, size=size.small)
plotshape(series=shortCondition, title="Señal de Venta", location=location.abovebar, color=color.red, style=shape.triangledown, size=size.small)
Detail
https://www.fmz.com/strategy/442567
Last Modified
2024-02-22 18:06:08
