Name
周线突破平均线交易策略Weekly-Breakthrough-Moving-Average-Trading-Strategy
Author
ChaoZhang
Strategy Description
[trans]
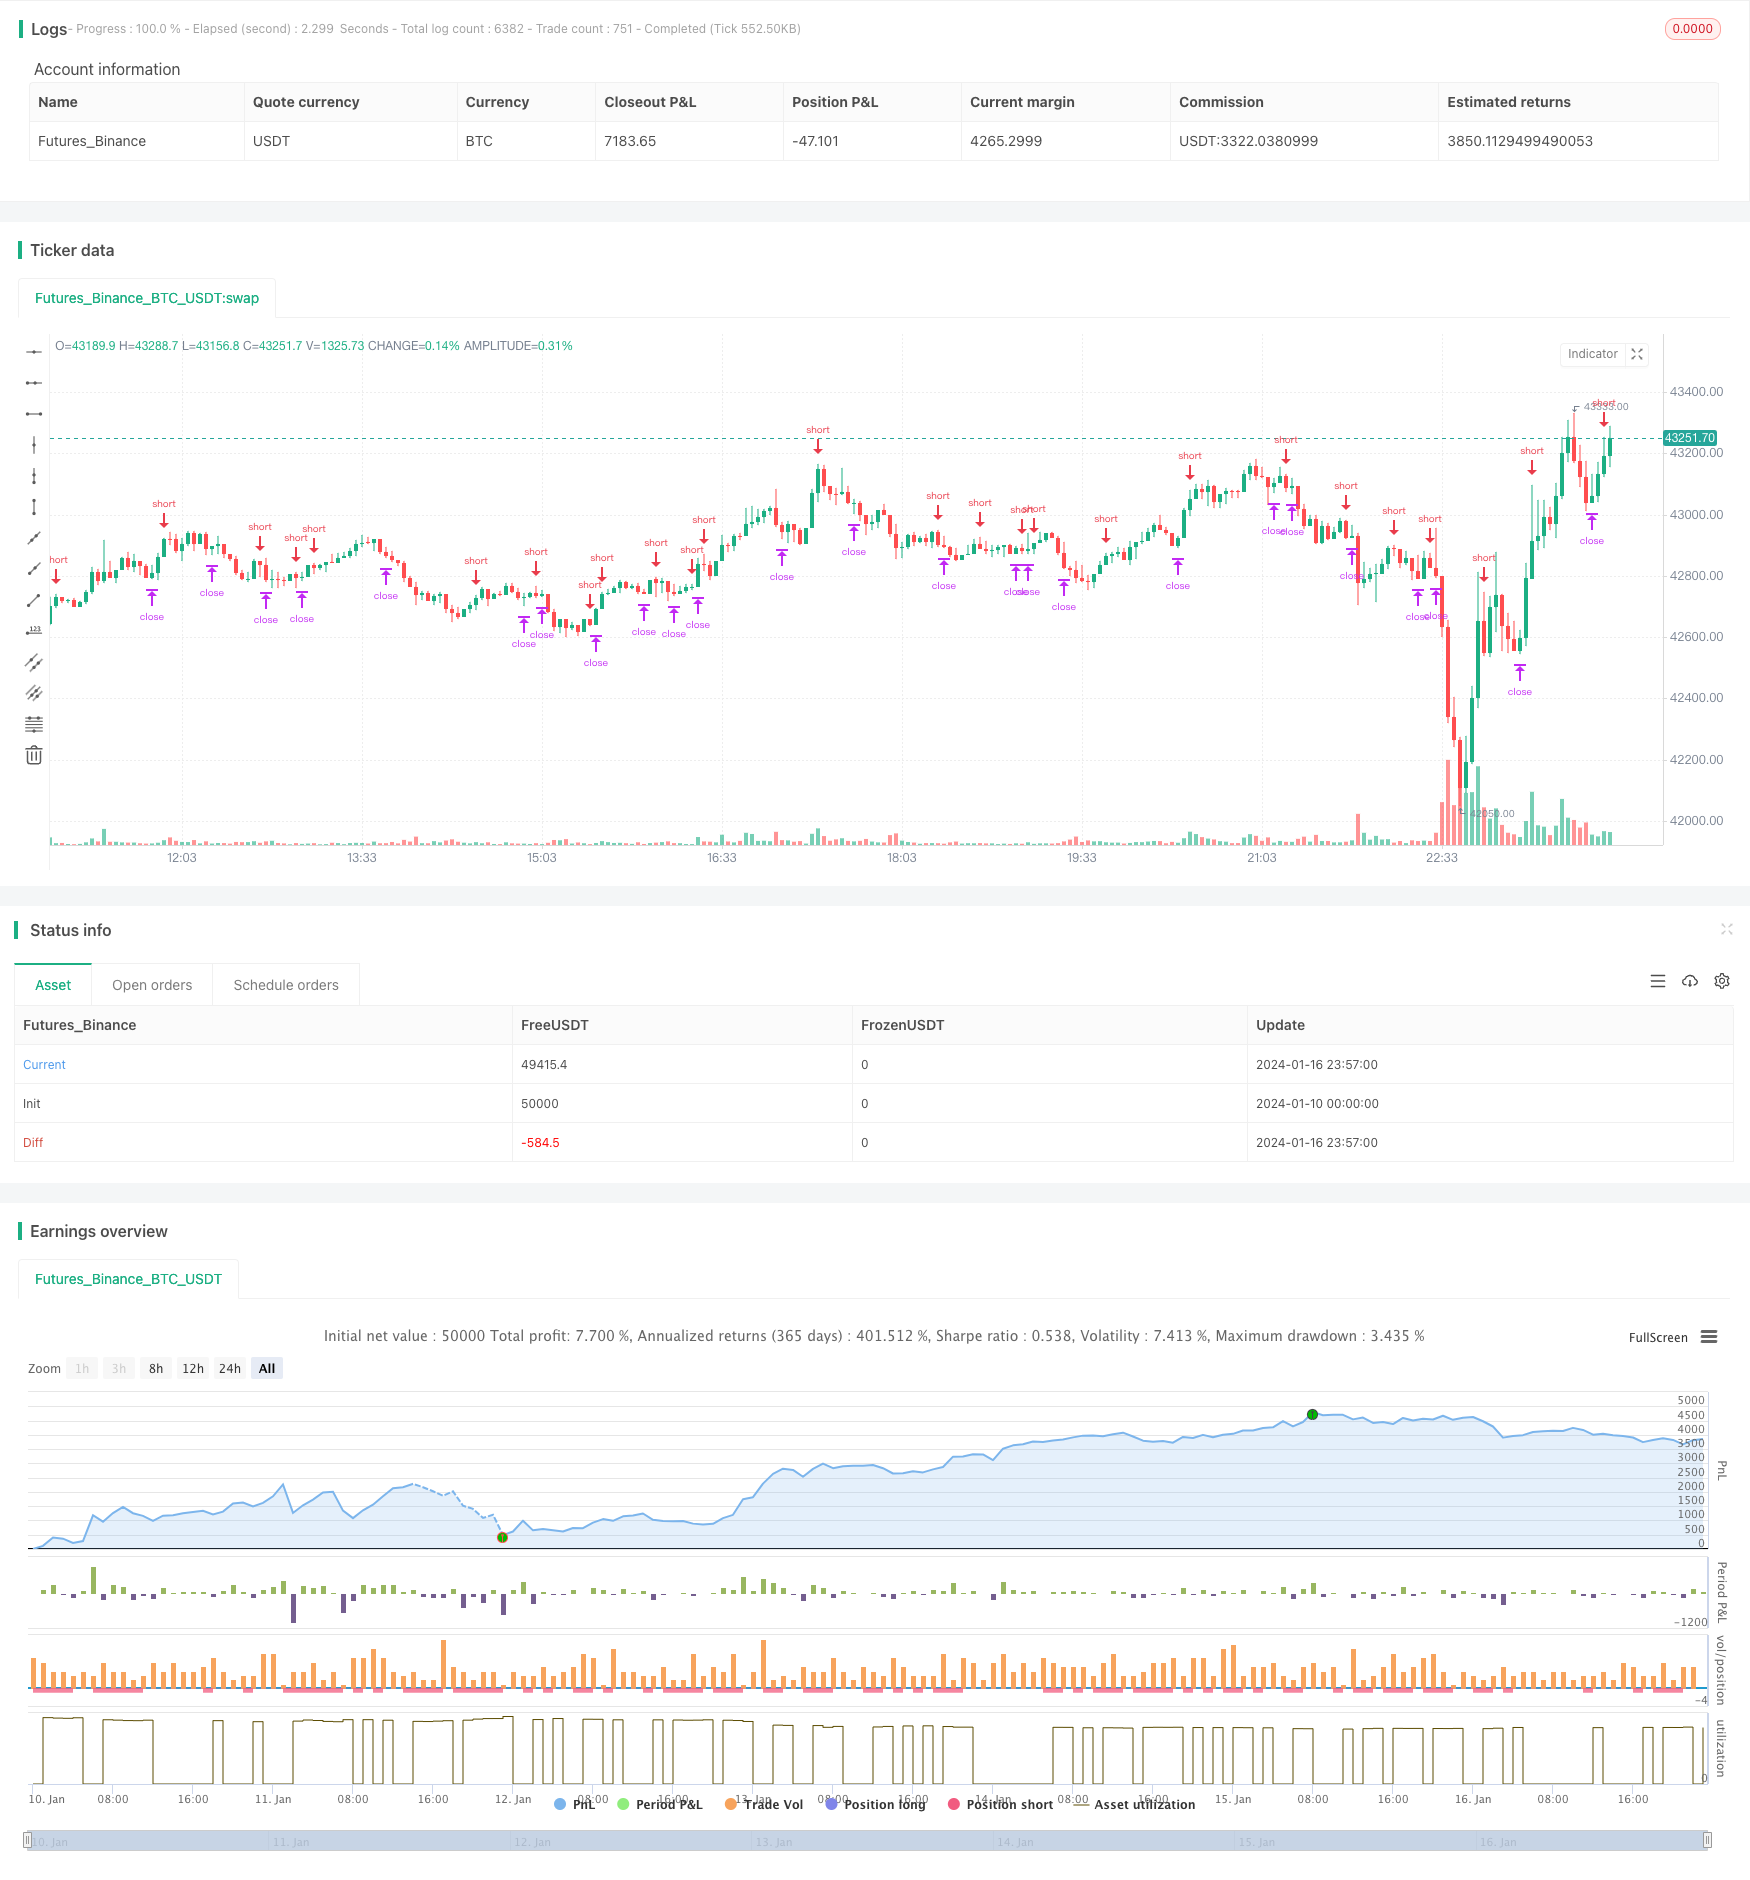
该策略基于比特币的周线收盘价和8周简单移动平均线进行交易。当周线收盘价上穿8周线时,做多;当周线收盘价下穿8周线时,平仓。同时设置了止损止盈比例,以控制风险。
该策略通过分析比特币的周线行情及8周简单移动平均线,判断市场目前是处于上涨趋势还是下跌趋势。当周线收盘价突破向上突破8周线时,表示市场步入上涨通道,做多能获利;当周线收盘价下方穿越8周线时,表示比特币周线进入下跌通道,应当止损了结此前的多单。
具体来说,策略里设置了以下判断条件:
buy_condition= crossover(btc,ma)#周线收盘价上穿8周线,做多
sell_condition= crossunder(btc,ma)#周线收盘价下穿8周线,平仓
当买入条件成立时,策略会进入做多;当平仓条件成立时,策略会选择止盈或止损出场。
此外,策略还设置了止损止盈的比例:
loss_ratio=input(defval=1,title="LOSS RATIO", group="STRATEGY")
reward_ratio=input(defval=3,title="REWARD RATIO", group="STRATEGY")
其中,止损比例默认为1,止盈比例默认为3。这意味着当平仓信号来时,如果当前盈利,则会以盈利的3倍来止盈;如果当前亏损,则会以亏损的1倍来止损。
该策略具有以下优势:
- 周线操作,回撤小,适合长线持有
- 8周线过滤震荡,识别主要趋势
- 设置止损止盈,控制风险
该策略也存在一些风险:
- 周线操作,无法针对短期行情调整仓位
- 突破信号可能出现错误信号
- 市场异常时,止损止盈设置可能失效
对策:
- 可结合其他短周期指标,识别短期调整的机会
- 增加过滤条件,避免错误信号
- 根据市场情况调整止损止盈比例,降低亏损
该策略可以从以下几个方面进行优化:
- 增加其他过滤条件,确保突破信号的有效性
- 优化止损止盈比例的设置
- 结合短周期指标,实现多时间框架的配合
- 利用机器学习算法自动优化参数
该策略整体来说比较简单直接,通过周线突破平均线来判断行情趋势;同时设置了止损止盈来控制风险。可作为长线持有比特币的参考。但该策略也存在一定盲区,后续可从提高信号有效性、优化参数设置、实现多时间框架结合等方面进行改进。
||
This strategy trades based on the weekly closing price of Bitcoin and the 8-week simple moving average. It goes long when the weekly closing price breaks above the 8-week line and closes the position when the weekly closing price breaks below the 8-week line. It also sets stop loss and take profit ratios to control risks.
This strategy analyzes the weekly price action of Bitcoin and the 8-week simple moving average to judge if the market is in an uptrend or a downtrend. When the weekly closing price breaks above the 8-week line, it signals that the market has entered an uptrend channel and a long position could profit. When the weekly closing price breaks below the 8-week line, it signals that the Bitcoin weekly chart has entered a downtrend channel and existing long positions should be stopped out.
Specifically, the following trading conditions are set in the strategy:
buy_condition = crossover(btc,ma) #weekly closing price breaks above 8-week line, go long
sell_condition = crossunder(btc,ma) #weekly closing price breaks below 8-week line, close position
When the buy condition is met, the strategy goes long. When the sell condition is triggered, the strategy exits with either take profit or stop loss.
In addition, stop loss and take profit ratios are configured:
loss_ratio=input(defval=1,title="LOSS RATIO", group="STRATEGY")
reward_ratio=input(defval=3,title="REWARD RATIO", group="STRATEGY")
The default stop loss ratio is 1 and default take profit ratio is 3. This means that when exit signal comes, if currently profitable, exit with 3 times profit. If currently loss, exit with 1 times loss.
The advantages of this strategy include:
- Weekly timeframe, less drawdown, suitable for long term holding
- 8-week MA filters out noise and identifies major trends
- Stop loss and take profit controls risk
There are also some risks:
- Unable to adjust position based on short-term price action
- Breakout signals may have false signals
- Stop loss/take profit may fail during extreme market events
Countermeasures:
- Combine with other short-term indicators to catch short-term opportunities
- Add filters to avoid false signals
- Adjust stop loss/take profit ratios based on market conditions to limit losses
Some ways this strategy can be improved:
- Add additional filters to ensure valid breakout signals
- Optimize stop loss and take profit ratios
- Incorporate short-term indicators for multi-timeframe analysis
- Use machine learning to auto-optimize parameters
In summary, this is a simple and straightforward strategy that judges trend based on weekly breakouts and moving average. It also controls risk via stop loss and take profit. It can serve as a reference system for long-term Bitcoin holdings. But there are some limitations that can be improved on signal quality, parameter tuning, multi-timeframe analysis etc.
[/trans]
Strategy Arguments
| Argument | Default | Description |
|---|---|---|
| v_input_1_close | 0 | (?STRATEGY)source: close |
| v_input_7 | true | LOSS RATIO |
| v_input_8 | 3 | REWARD RATIO |
| v_input_2 | #FF3232 | (?MA)COLOR |
| v_input_3 | 2 | LINE WIDTH |
| v_input_4 | #6666FF | (?GRAPHIC)COLOR |
| v_input_5 | 2 | LINE WIDTH |
| v_input_6 | 2020 | (?STRATEGY EXECUTION YEAR)YEAR |
Source (PineScript)
/*backtest
start: 2024-01-10 00:00:00
end: 2024-01-17 00:00:00
period: 3m
basePeriod: 1m
exchanges: [{"eid":"Futures_Binance","currency":"BTC_USDT"}]
*/

// This source code is subject to the terms of the Mozilla Public License 2.0 at https://mozilla.org/MPL/2.0/
// © taberandwords
//developer: taberandwords
//author: taberandwords
//@version=4

strategy("WEEKLY BTC TRADING SCRYPT","WBTS",overlay=false,default_qty_type=strategy.fixed)

source=input(defval=close,title="source",group="STRATEGY")

btc=security('BTCUSDT','1W', source)
ma=sma(btc,8)

buy_condition= crossover(btc,ma)
sell_condition= crossunder(btc,ma)

ma_color=input(defval=#FF3232,title="COLOR",group="MA")
ma_linewidth=input(defval=2,title="LINE WIDTH",group="MA")
graphic_color=input(defval=#6666FF,title="COLOR",group="GRAPHIC")
graphic_linewidth=input(defval=2,title="LINE WIDTH",group="GRAPHIC")

start_date=input(defval=2020,title="YEAR",group="STRATEGY EXECUTION YEAR")

loss_ratio=input(defval=1,title="LOSS RATIO", group="STRATEGY")
reward_ratio=input(defval=3,title="REWARD RATIO", group="STRATEGY")

if(year>=start_date)
    strategy.entry('BUY',long=true,when=buy_condition,alert_message='Price came to buying value!')

    if(strategy.long)
        alert('BTC buy order trigerred!',alert.freq_once_per_bar)
    strategy.exit(id="SELL",loss=loss_ratio,profit=reward_ratio,when=sell_condition,alert_message='Price came to position closing value!')
    if(sell_condition)
        alert('BTC sell order trigerred!',alert.freq_once_per_bar)
plot(series=source,title="WEEKLY CLOSE",color=graphic_color,linewidth=graphic_linewidth)
plot(ma,title="SMA8 WEEKLY",color=ma_color,linewidth=ma_linewidth)
plot(strategy.equity,display=0)
Detail
https://www.fmz.com/strategy/439195
Last Modified
2024-01-18 11:47:25
