Name
双EMA黄金交叉算法策略Dual-EMA-Golden-Cross-Strategy
Author
ChaoZhang
Strategy Description
[trans]
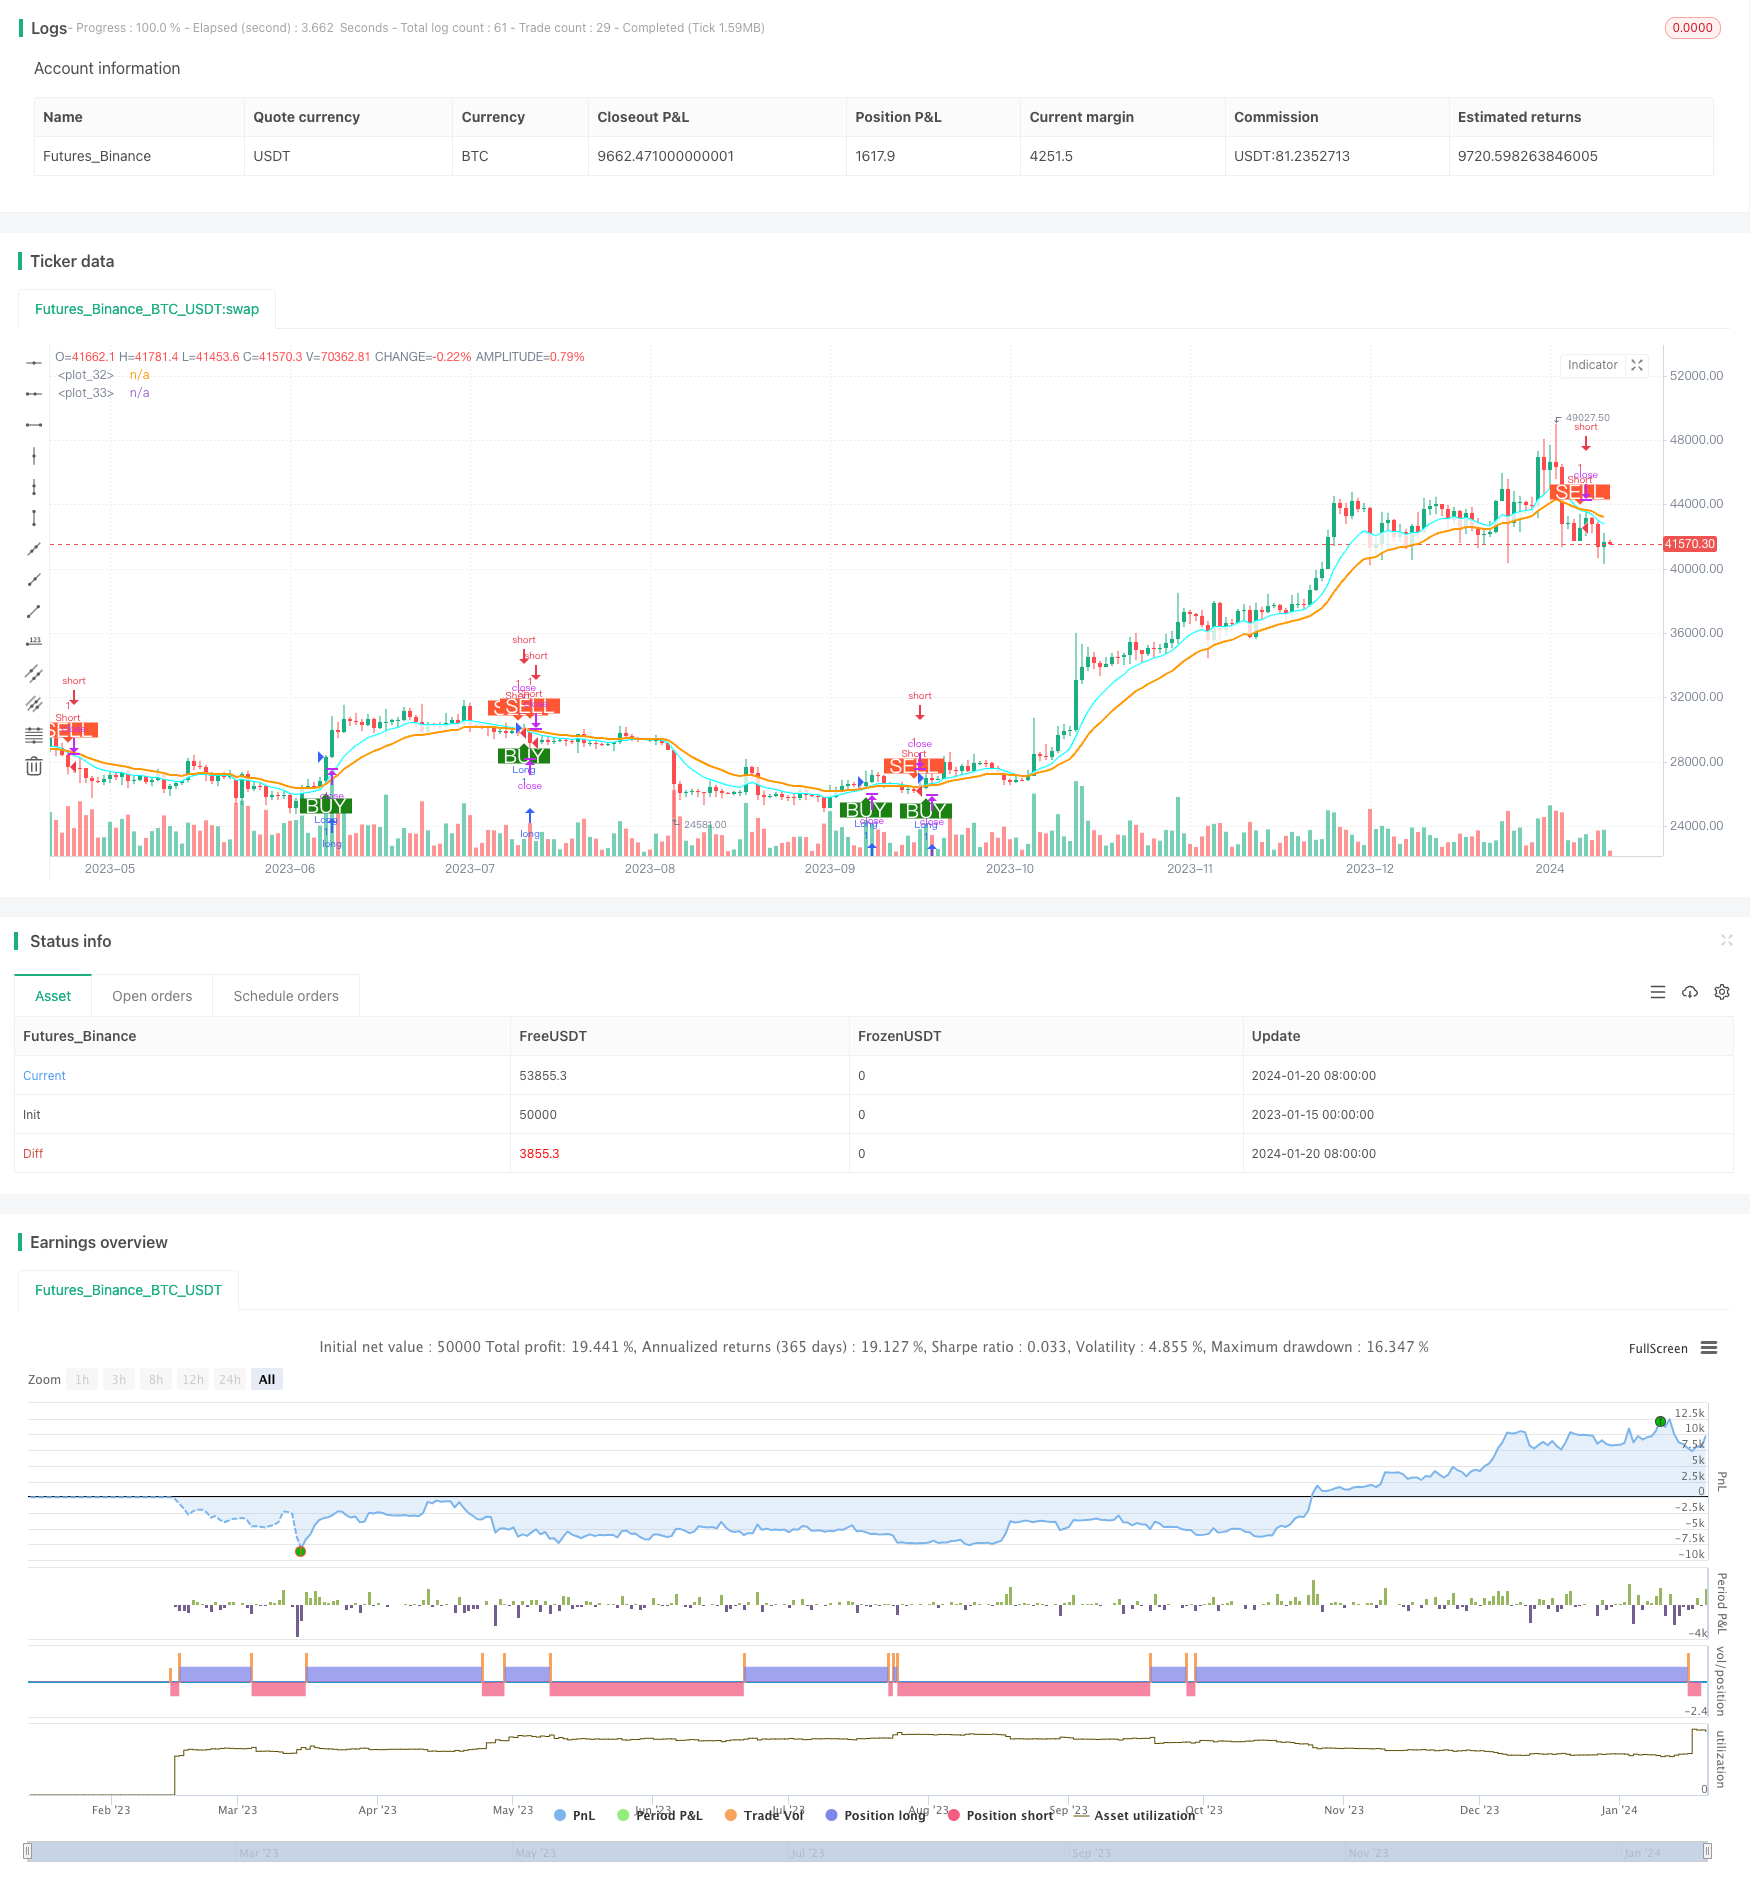
本策略通过计算快线EMA和慢线EMA的交叉情况,实现黄金交叉和死亡交叉交易信号的生成。当快线EMA上穿慢线EMA时,产生买入信号;当快线EMA下穿慢线EMA时,产生卖出信号。该策略充分利用了移动平均线的优势,能够有效跟踪市场趋势,在趋势启动阶段产生交易信号。
本策略的核心指标是快速EMA线和慢速EMA线。策略通过设置两个不同参数的EMA线,快线EMA参数设置为10,慢线EMA参数设置为20。其中,10日EMA线能更快速地响应价格变动,而20日线响应速度较慢。当短期EMA线上穿长期EMA线时,代表短期平均线开始引领长期平均线向上,说明行情可能进入看涨状态,此时产生买入信号;相反,当短期平均线下穿长期平均线时,代表短期均线开始失去对长期均线的领先优势,说明行情可能进入看跌状态,此时产生卖出信号。
通过快慢EMA线的交叉原理,本策略充分捕捉到市场趋势的转换时机,能够及时产生交易信号。同时,EMA指标本身具有滤波假信号的能力,避免在市场震荡时频繁开仓。这使得该策略能够在减少错误交易的同时,捕捉市场转折点,具有较高的盈利能力。
- 利用EMA交叉原理,捕捉市场转折点,盈利能力较强
- 快速EMA线和慢速EMA线配合使用,发挥各自优势
- EMA本身具有滤波作用,可以减少错误交易
- 实现简单,容易理解和优化
- 可扩展性强,可引入其他辅助指标进一步优化
- 双EMA交叉在震荡市中可能产生频繁错误信号
- EMA参数设置不当可能错过市场转折点
- 存在一定的滞后,可能错过短线操作机会
- 无法应对剧烈行情的突变
针对上述风险,可以通过引入附加指标进行优化,例如增大交易过滤条件,结合MACD指标避免错误信号,使用自适应EMA加速指标响应速度等。此外,合理止损和积极止盈也是必要的。
本策略可进一步优化的方向包括:
- 增加开仓过滤:比如结合交易量指标,避免低量假突破
- 结合MACD等辅助指标,进一步避免错误信号
- 引入自适应EMA,根据市场情况动态调整EMA参数
- 多时间框架联合操作,发挥不同周期EMA的优势
- 优化止损策略,通过移动止损、比率止损等方式锁定利润
- 结合深度学习等技术实现参数自动优化
本策略通过双EMA快慢线交叉原理,捕捉市场关键转折点,具有较强的实盘效果。配合辅助指标和优化止损,可以进一步增强策略稳定性。该策略思路简单清晰,值得量化交易者学习和运用,也有很大的拓展空间和优化潜力。
||
This strategy generates trading signals based on the crossovers between fast EMA line and slow EMA line. When the fast EMA line crosses above the slow EMA line, a buy signal is generated. When the fast EMA line crosses below the slow EMA line, a sell signal is generated. This strategy utilizes the advantage of moving average to effectively track market trend and generate trading signals during trend initiation.
The core indicators of this strategy are fast EMA line and slow EMA line. The strategy sets up two EMA lines with different parameters, with 10 for fast EMA and 20 for slow EMA. The 10-day EMA line responds faster to price changes, while the 20-day line responds more slowly. When the short-term EMA line crosses above the long-term EMA line, it means the short-term average line starts leading the long-term line upwards, implying the market may switch to bull state. At this point, a buy signal is generated. On the contrary, when the short EMA falls below the long EMA, it means the short EMA starts to lose its leading power ahead of the long EMA, implying the market may switch to bear state. Accordingly, a sell signal is generated.
By leveraging the crossover logic between fast and slow EMA lines, this strategy captures the switching points of market trend timely and generates trading signals accordingly. Meanwhile, the EMA itself has the capability to filter out false signals, avoiding excessive trading during market consolidation. This allows the strategy to capture market turning points while reducing wrong trades, leading to superior profitability.
- Captures market turning points via EMA crossover rules for strong profitability
- Utilizes both fast and slow EMA lines for their respective merits
- Inherent noise filtering capability of EMA reduces wrong trades
- Simple to understand, optimize and extend
- High extendibility to incorporate other assisting indicators
- Frequent false signals may occur during range-bound markets
- Improper EMA parameter setting may cause missing major turns
- Lagging issue may result in missing short-term trading chances
- Unable to adapt to drastic market turbulence
To address these risks, optimizations can be introduced like adding filtering rules, combining MACD to avoid false signals, using adaptive EMA to accelerate response etc. Also, proper stop loss and profit taking mechanisms are necessary.
The potential directions for further optimization include:
- Adding filtering rules on entry signals, e.g. combine trading volume
- Incorporating assisting indicators like MACD for supplementary signals
- Introducing adaptive EMA to tune parameters dynamically
- Applying multi-timeframe analysis to leverage different EMAs
- Optimizing stop loss strategies via trailing stop, percent stop etc.
- Leveraging AI technologies for automatic parameter tuning
This strategy captures critical market turning points through the crossover logic of dual EMA lines, making it effective for live trading. With additional filters, assisting indicators and stop loss optimizations, the stability of the strategy can be further enhanced. The strategy logic is straight-forward and worth learning for quant traders, with abundant potential for extensions and improvements.
[/trans]
Strategy Arguments
| Argument | Default | Description |
|---|---|---|
| v_input_1 | 100000 | Buy quantity |
| v_input_2 | 2019 | Backtest Start Year |
| v_input_3 | true | Backtest Start Month |
| v_input_4 | true | Backtest Start Day |
| v_input_5 | false | Backtest Start Hour |
| v_input_6 | false | Backtest Start Minute |
| v_input_7 | 2099 | Backtest Stop Year |
| v_input_8 | true | Backtest Stop Month |
| v_input_9 | 30 | Backtest Stop Day |
| v_input_10 | true | Color Background? |
| v_input_11 | 10 | Select EMA 1 |
| v_input_12 | 20 | Select EMA 2 |
Source (PineScript)
/*backtest
start: 2023-01-15 00:00:00
end: 2024-01-21 00:00:00
period: 1d
basePeriod: 1h
exchanges: [{"eid":"Futures_Binance","currency":"BTC_USDT"}]
*/

//@version=4
strategy("Backtest single EMA cross", overlay=true)

qty = input(100000, "Buy quantity")

testStartYear = input(2019, "Backtest Start Year")
testStartMonth = input(1, "Backtest Start Month")
testStartDay = input(1, "Backtest Start Day")
testStartHour = input(0, "Backtest Start Hour")
testStartMin = input(0, "Backtest Start Minute")
testPeriodStart = timestamp(testStartYear, testStartMonth, testStartDay, testStartHour, testStartMin)
testStopYear = input(2099, "Backtest Stop Year")
testStopMonth = input(1, "Backtest Stop Month")
testStopDay = input(30, "Backtest Stop Day")
testPeriodStop = timestamp(testStopYear, testStopMonth, testStopDay, 0, 0)
testPeriodBackground = input(title="Color Background?", type=input.bool, defval=true)
testPeriodBackgroundColor = testPeriodBackground and time >= testPeriodStart and time <= testPeriodStop ?
   #00FF00 : na
testPeriod() => true


ema1 = input(10, title="Select EMA 1")
ema2 = input(20, title="Select EMA 2")

expo = ema(close, ema1)
ma = ema(close, ema2)

avg_1 = avg(expo, ma)
s2 = cross(expo, ma) ? avg_1 : na
//plot(s2, style=plot.style_line, linewidth=3, color=color.red, transp=0)

p1 = plot(expo, color=#00FFFF, linewidth=2, transp=0)
p2 = plot(ma, color=color.orange, linewidth=2, transp=0)
fill(p1, p2, color=color.white, transp=80)

longCondition = crossover(expo, ma)

shortCondition = crossunder(expo, ma)


if testPeriod()
    strategy.entry("Long", strategy.long, when=longCondition)
    strategy.entry("Short", strategy.short, when=shortCondition)

plotshape(longCondition, title = "Buy Signal", text ="BUY", textcolor =#FFFFFF , style=shape.labelup, size = size.normal, location=location.belowbar, color = #1B8112, transp = 0)
plotshape(shortCondition, title = "Sell Signal", text ="SELL", textcolor = #FFFFFF, style=shape.labeldown, size = size.normal, location=location.abovebar, color = #FF5733, transp = 0)
Detail
https://www.fmz.com/strategy/439612
Last Modified
2024-01-22 11:04:41
