Name
双重底部反转均线DCA网格策略Double-Bottom-Reversal-Mean-Reversion-DCA-Grid-Strategy
Author
ChaoZhang
Strategy Description
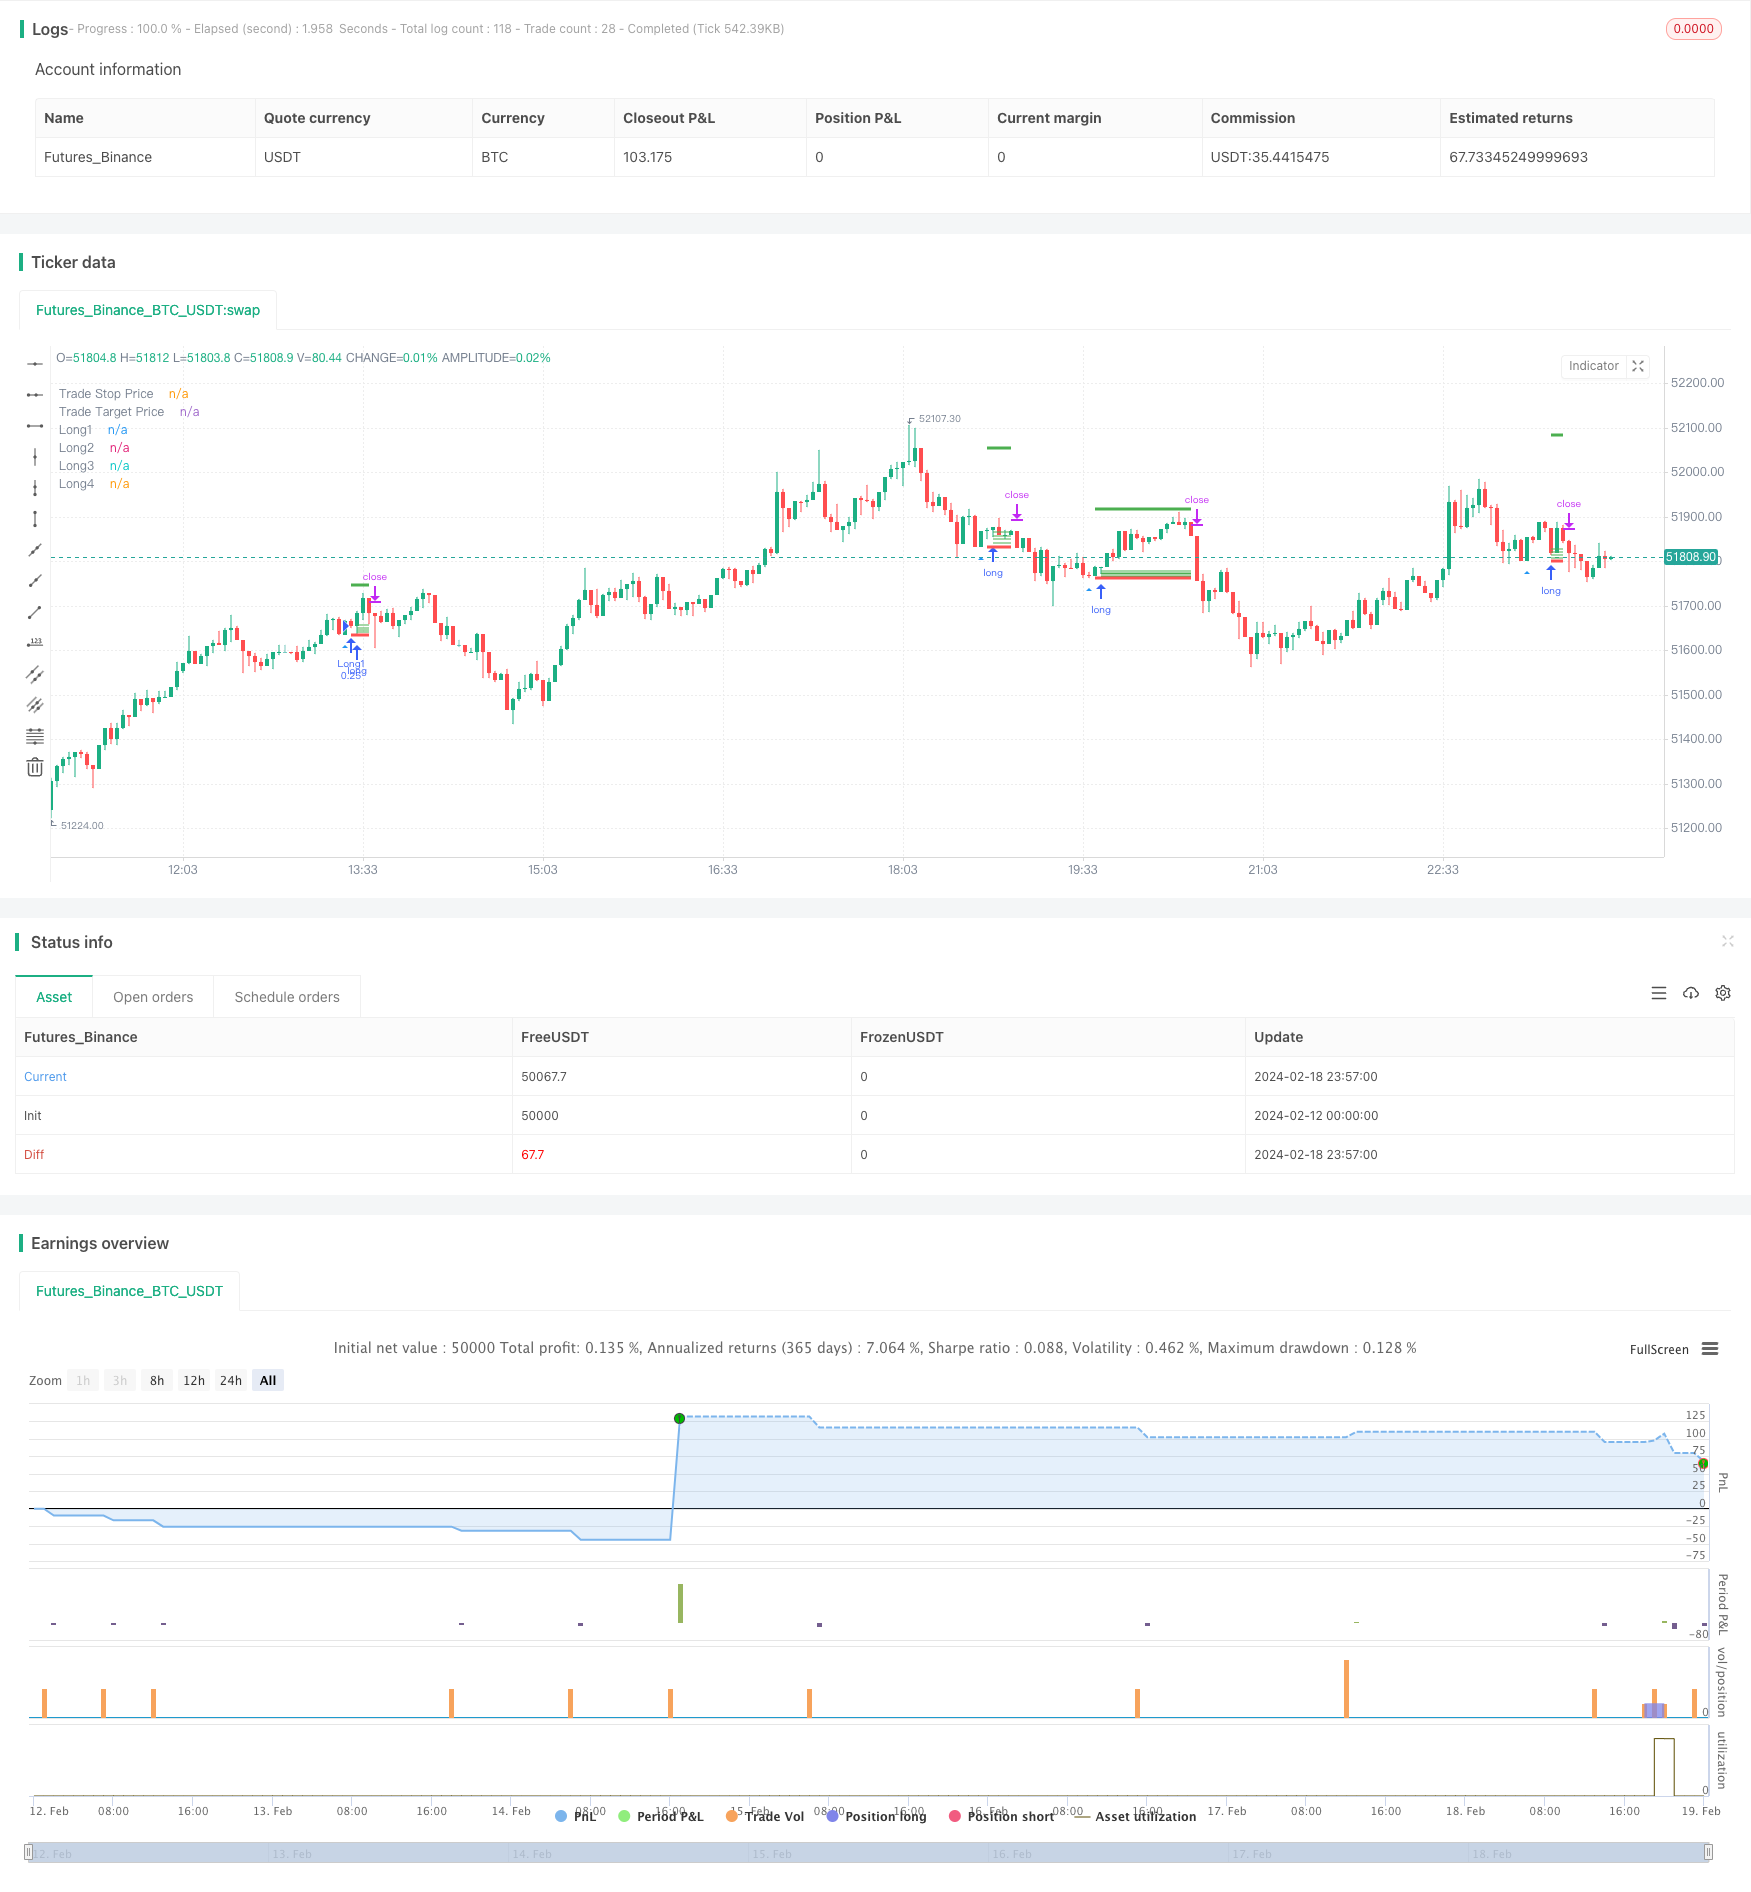
双重底部反转均线DCA网格策略主要应用均线价格反转和DCA策略实现网格逐步建仓。它根据双重底部反转形态来判断反转机会。一旦触发反转形态后,使用多个不同价格的委托单,结合DCA建立逐步网格仓位。
该策略首先判断K线是否出现连续两个收盘价相等的底部,这被称为“双重底”。如果检测到双重底,则认为可能出现价格反转机会。此时,策略会在底部附近设置多笔限价委托单,这些委托单的价格会按照ATR和波动率计算,形成一个网格区间。这实现了DCA的效果,可以让交易者在反转后的不同价格点逐步建仓。
具体来说,首先通过ta.atr计算最近14根K线的ATR指标,然后结合最近5根K线计算价格波动率,这是用来确定网格区间的主要参数。网格区间分为4个价格点,分别是底部价格+波动率、底部价格+0.75倍波动率,以此类推。当触发双重底条件后,按这个计算公式在对应价格设置4笔限价委托单,每笔数量相等。未成交的挂单会在设置的蜡烛数后自动撤单。
此外,策略还会设置止损位和止盈位。止损价格为双重底的最低价-最小跳动位,止盈价格为入场价+ATR指标的5倍。当仓位不为0时,这两个价格会实时更新。
该策略具有以下优势:
- 利用双重底判断反转时点,可以有效避免假突破。
- DCA网格设计让交易者能以不同价格逐步建仓,降低仓位成本。
- ATR和波动率参数可以动态调整网格和止盈空间,适应市场变化。
- 自动止损机制可以有效控制单笔损失。
主要风险有:
- 价格可能不会反转,直接跌破双重底支持位。此时止损会被触发,造成损失。可以适当拉大止损距离。
- DCA网格区间设定不当,大部分委托无法成交。可以测试不同参数,确保成交率。
- 市场震荡剧烈时,止盈可能会被频繁触发。可以考虑适当扩大止盈倍数。
该策略还可以从以下几个方向进行优化:
- 增加趋势判断,只在看多趋势中进行反转操作,避免错过大趋势。
- 考虑加大首单仓位,后续网格仓位逐步减小,优化资金使用效率。
- 测试不同的参数组合,找到最佳参数。也可以设计动态参数,根据市场实时调整。
- 可以在高级平台中集成机器学习,实现参数的自动优化。
双重底部反转均线DCA网格策略综合运用了价格形态、均线指标、网格交易等多种技术手段。它具有判断时点精准、成本可控、回撤有保护等优点。该策略优化空间还很大,值得深度研究与应用。如果参数调整得当,在震荡行情中可以获得不错的效果。
||
The Double Bottom Reversal Mean Reversion DCA Grid strategy mainly applies the mean reversion price and DCA strategy to implement gradual position building. It determines reversal opportunities based on the double bottom reversal pattern. Once the reversal pattern is triggered, it uses multiple limit orders at different prices combined with DCA to establish gradual grid positions.
The strategy first checks if there are two consecutive closing prices equal to the bottom on the candlestick chart, which is called a "double bottom". If a double bottom is detected, it considers there may be a price reversal opportunity. At this point, the strategy will set multiple limit orders around the bottom price. The prices of these orders will be calculated based on ATR and volatility, forming a grid zone. This achieves the DCA effect and allows traders to gradually build positions at different prices after the reversal.
Specifically, the ATR indicator over the recent 14 candlesticks is first obtained through ta.atr. Then the price volatility over the recent 5 candlesticks is calculated. They are the main parameters used to determine the grid zone. The grid contains 4 price levels - bottom price + volatility, bottom price + 0.75 * volatility, and so on. Once the double bottom condition triggers, 4 limit orders with equal size will be placed according to this formula. The unfilled orders will be cancelled after several candlesticks.
In addition, the strategy also sets a stop loss price and a take profit price. The stop loss price is set to the lowest price of the double bottom minus one tick size, while the take profit price is set to the entry price plus 5 times the ATR. These two prices will update in real-time when the position size is greater than 0.
The main advantages of this strategy are:
- Using double bottom to determine reversal improves accuracy and avoids false breaks.
- The DCA grid allows traders to gradually build positions at different prices, lowering cost basis.
- Dynamic ATR and volatility parameters adjust grid and profit range based on market changes.
- Auto stop loss effectively controls per trade loss amount.
Major risks:
- Price may break through support without reversal, triggering stop loss and losses. Widen stop loss distance for protection.
- Improper DCA grid setting may lead to low fill rate. Test different parameters to ensure fill rate.
- Frequent take profit with whipsaws in volatile market. Consider allowing wider take profit multiples.
Some areas that can be improved:
- Add trend judgment, only trade reversals along the major trend to avoid losses.
- Consider larger size for first entry and smaller sizes for grid entries to optimize capital usage efficiency.
- Test different parameter combinations to find optimum parameters. Or design dynamic adjusting logics.
- Integrate machine learning in advanced platform to achieve auto parameter optimization.
The Double Bottom Reversal Mean Reversion DCA Grid Strategy consolidates price pattern, indicator techniques and grid trading. It has accurate timing, controllable cost basis and drawdown protection. Still has room for optimization and is worth researching. Properly configured, can achieve good results in range-bound markets. [/trans]
Strategy Arguments
| Argument | Default | Description |
|---|---|---|
| v_input_int_1 | 14 | (?Strategy Settings)ATR length for taking profit |
| v_input_int_2 | 5 | ATR multiplier |
| v_input_int_3 | 5 | Volatility length |
| v_input_float_1 | 0.5 | Volatility multiplier |
| v_input_int_4 | 4 | How many candles to wait after placing orders grid? |
Source (PineScript)
/*backtest
start: 2024-02-12 00:00:00
end: 2024-02-19 00:00:00
period: 3m
basePeriod: 1m
exchanges: [{"eid":"Futures_Binance","currency":"BTC_USDT"}]
*/

// This source code is subject to the terms of the Mozilla Public License 2.0 at https://mozilla.org/MPL/2.0/
// © cherepanovvsb

//@version=5
strategy("Reversal (only long)", overlay=true, margin_long=1, margin_short=1,initial_capital=1000,commission_type = strategy.commission.percent,commission_value =0.1,currency='USD', process_orders_on_close=true)
plotshape(low == low[1], style=shape.triangleup, location=location.belowbar, color=color.blue, title="1 Setup")
plotshape(low == low[1] and low[1]==low[2], style=shape.triangleup, location=location.belowbar, color=color.red, title="Triple Setup")

ATRlenght   = input.int(title="ATR length for taking profit", defval=14, group="Strategy Settings")
rewardMultiplier= input.int(title="ATR multiplier", defval=5, group="Strategy Settings")
Volatility_length=input.int(title='Volatility length',defval=5,group="Strategy Settings")
Volatility_multiplier=input.float(title='Volatility multiplier',defval=0.5,step=0.1, group="Strategy Settings")
Candles_to_wait=input.int(title='How many candles to wait after placing orders grid?',defval=4,group="Strategy Settings")

// Get ATR
atr1 = ta.atr(ATRlenght)

//Get volatility values (not ATR)
float result = 0
for i = 0 to Volatility_length
	result+=high[i]-low[i]
volatility=result*Volatility_multiplier/Volatility_length

//Validate entrance points
validlow =  low [2]== low[1] and not na(atr1)
validlong = validlow and strategy.position_size == 0  and low[1]<low


// Calculate SL/TP
longStopPrice = low[1]-syminfo.mintick
longStopDistance = close - longStopPrice
longTargetPrice = close + (longStopDistance * rewardMultiplier)
strategy.initial_capital = 50000
//Assign all variables
var tradeStopPrice = 0.0
var tradeTargetPrice = 0.0
var point1=0.0
var point2=0.0
var point3=0.0
var point4=0.0
var contracts = int(strategy.initial_capital/close)/4
if validlong
    tradeStopPrice := longStopPrice
    tradeTargetPrice := longTargetPrice
    point1:=low[1]+volatility
    point2:=low[1]+volatility*0.75
    point3:=low[1]+volatility*0.5
    point4:=low[1]+volatility*0.25

strategy.entry ("Long1", strategy.long,limit=point1,qty=contracts, when=validlong)
strategy.entry ("Long2", strategy.long,limit=point2,qty=contracts, when=validlong)
strategy.entry ("Long3", strategy.long,limit=point3,qty=contracts, when=validlong)
strategy.entry ("Long4", strategy.long,limit=point4,qty=contracts, when=validlong)

stopcondition = ta.barssince(validlong) == Candles_to_wait

strategy.cancel("Long1",when=stopcondition)
strategy.cancel("Long2",when=stopcondition)
strategy.cancel("Long3",when=stopcondition)
strategy.cancel("Long4",when=stopcondition)

strategy.exit(id="Long Exit", limit=tradeTargetPrice, stop=tradeStopPrice, when=strategy.position_size > 0)

plot(strategy.position_size != 0 or validlong ? tradeStopPrice : na, title="Trade Stop Price", color=color.red, style=plot.style_linebr, linewidth=3)
plot(strategy.position_size != 0 or validlong ? tradeTargetPrice : na, title="Trade Target Price", color=color.green, style=plot.style_linebr, linewidth=3)

plot(strategy.position_size != 0? point1 : na, title="Long1", color=color.green, style=plot.style_linebr, transp=0)
plot(strategy.position_size != 0? point2 : na, title="Long2", color=color.green, style=plot.style_linebr, transp=0)
plot(strategy.position_size != 0? point3 : na, title="Long3", color=color.green, style=plot.style_linebr, transp=0)
plot(strategy.position_size != 0? point4 : na, title="Long4", color=color.green, style=plot.style_linebr, transp=0)
Detail
https://www.fmz.com/strategy/442205
Last Modified
2024-02-20 11:09:33
