Name
动量突破回测支持阻力策略Momentum-Breakout-Backtesting-Support-Resistance-Strategy
Author
ChaoZhang
Strategy Description
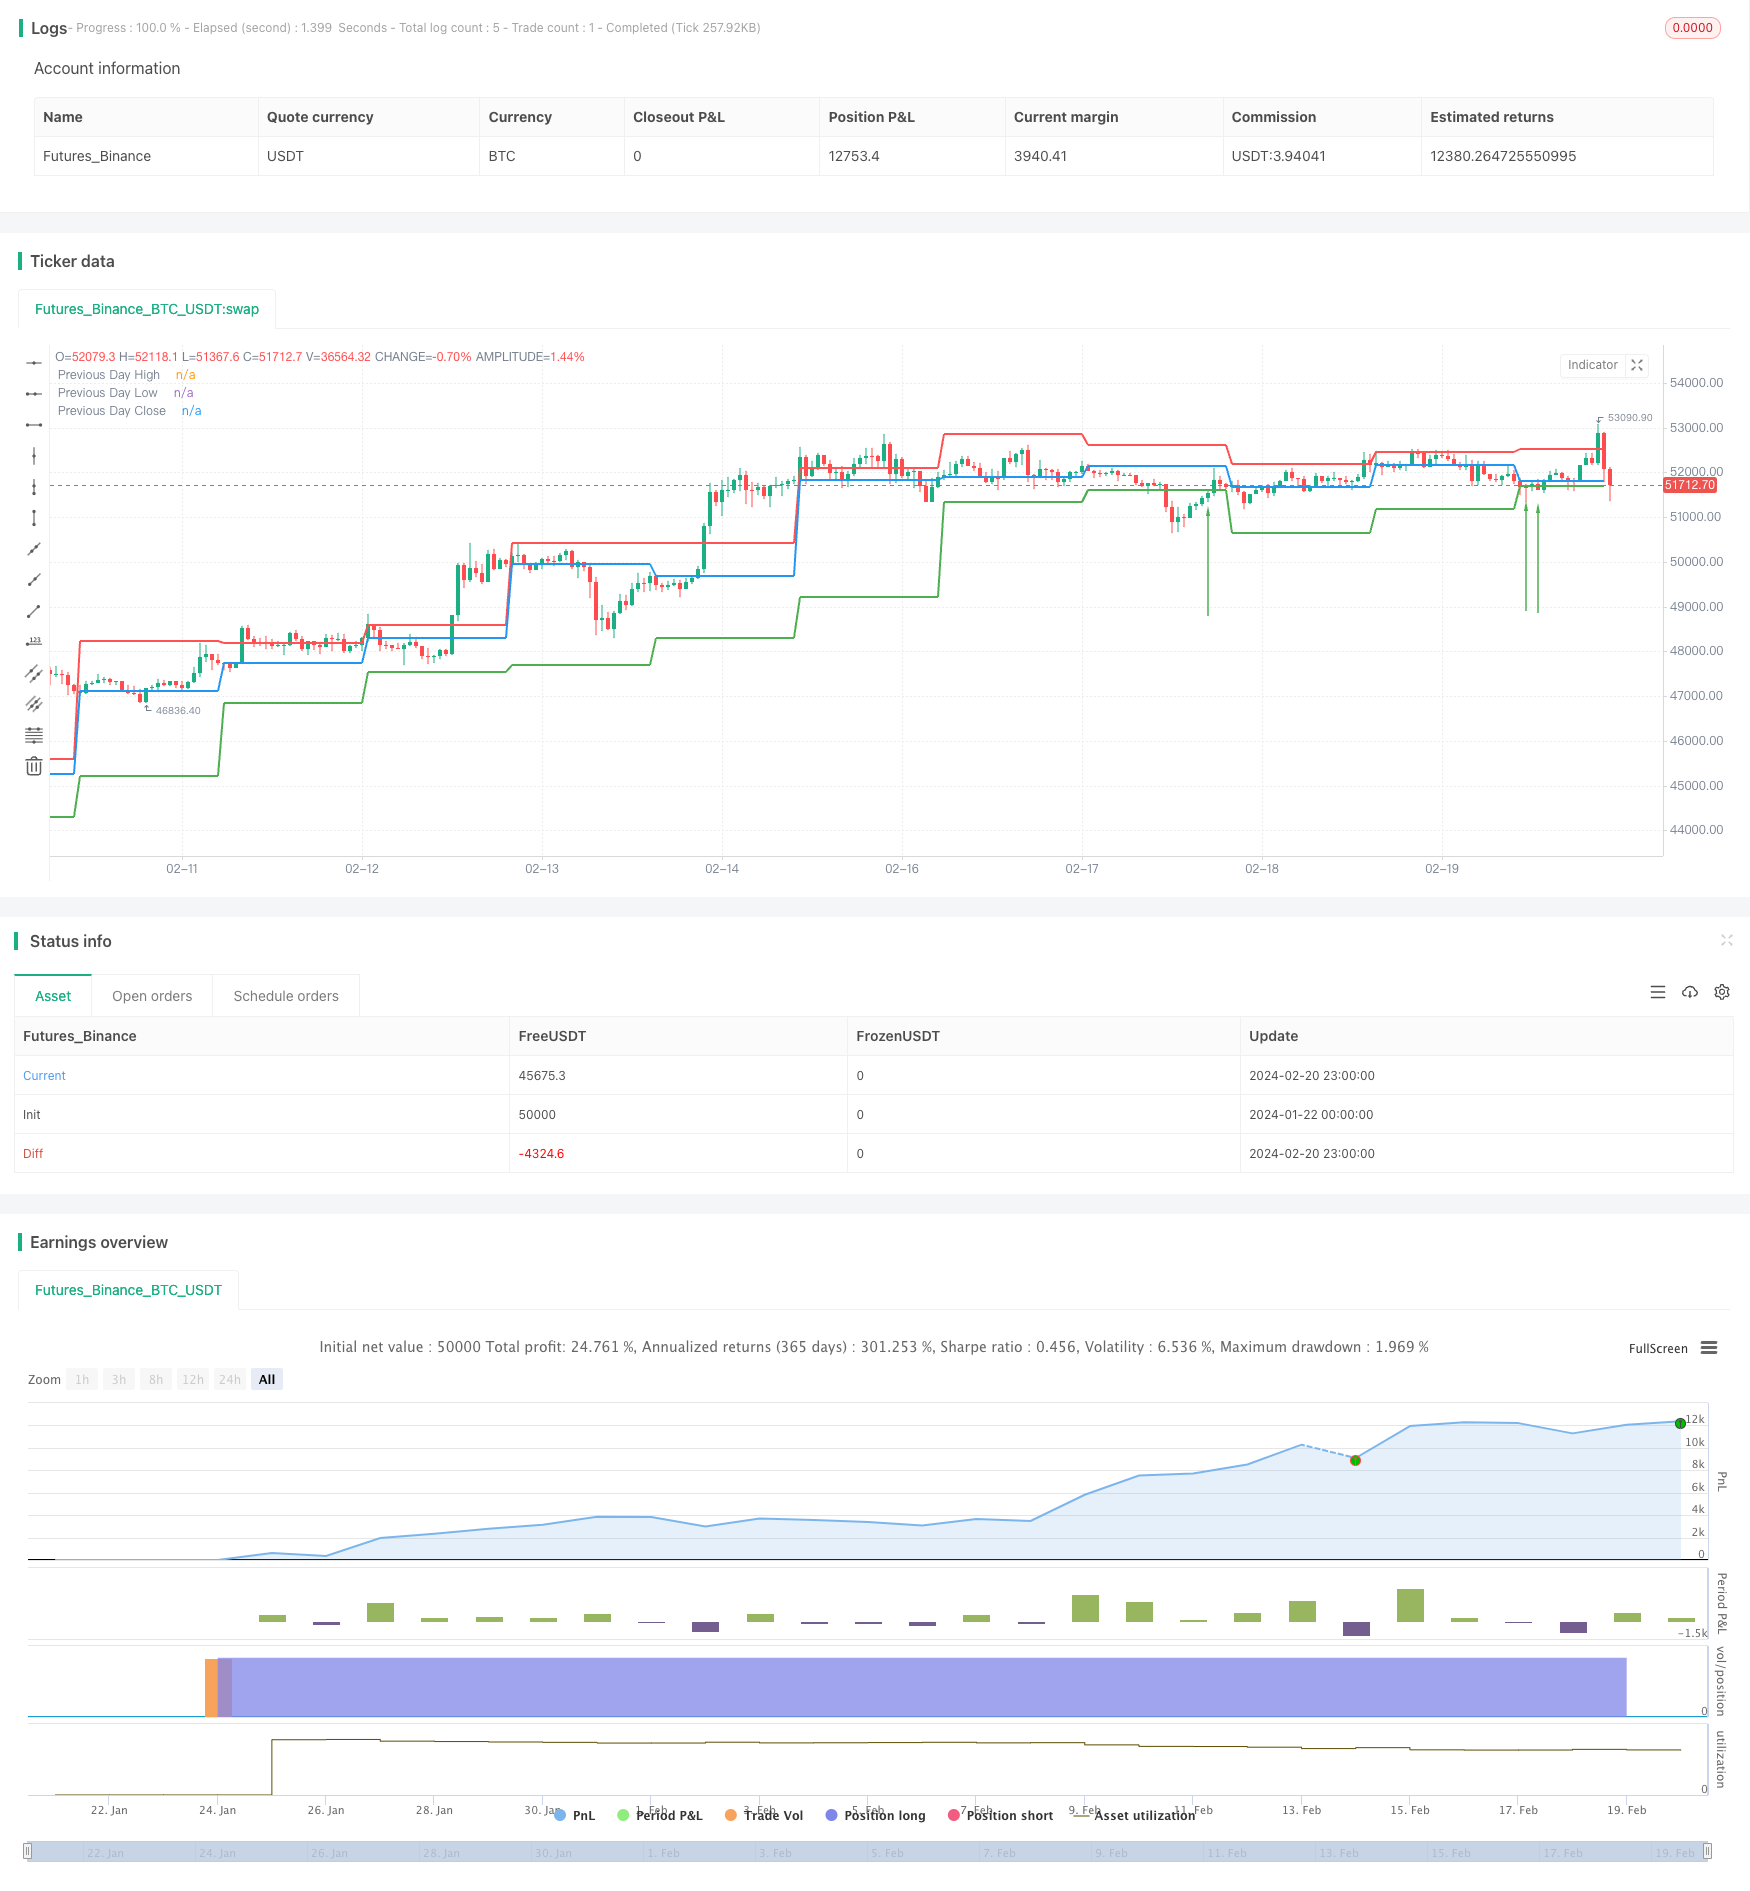
该策略主要利用前一交易日的最高价、最低价和收盘价作为当日的支撑和阻力位,在突破阻力位时做多,在回测试支撑位时做空,属于典型的突破策略。
代码首先定义了一个计算支撑阻力位的函数calculateSupportResistance,该函数提取前一交易日的最高价、最低价和收盘价,作为当日的支撑阻力位。
然后在主逻辑中调用该函数获取这三个价格位并绘图显示出来。
在回测逻辑中,如果收盘价低于前一日最低价同时当前价高于该最低价构成突破,则做多;如果收盘价高于前一日最高价同时当前价低于该最高价构成突破,则做空。
通过这样的突破模型实现对趋势的判断和交易信号的产生。
- 使用前一交易日的数据构建当日的支撑阻力位,避免了参数优化的问题
- 支撑阻力位来自真实市场交易数据,具有一定的参考价值
- 回测模型简单直接,容易理解实现
- 可视化显示支撑阻力位,形成对价格的感知
- 实时监控突破情况,及时捕捉交易机会
- 支撑阻力位会随着时间推移变化,无法确定其有效性
- 无法预测趋势方向,存在错过反转的风险
- 容易受到假突破的影响,出现过早入场的风险
- 无法确定突破持续性,存在过早止损的可能
- 大盘剧烈波动时,个股支撑阻力失效的可能较大
对策:
- 结合更多因素判断突破的有效性
- 适当放大止损幅度,确保抓住趋势
- 分批建立头寸,降低个股波动的影响
- 增加更多历史数据判断支撑阻力位,如5日线、10日线价格
- 结合交易量等指标判断突破的有效性
- 根据实际波动率设置止损位
- 优化资金管理,控制单笔损失
该策略整体来说属于典型的突破策略,简单直观,通过前一交易日数据构建当日支撑阻力,回测该位突破做多做空。优点是容易理解实现,可直接看到支撑阻力;缺点是存在假突破风险,无法确定趋势持续性。下一步可从确定突破效力、控制风险、优化资金管理等方面进行优化。
||
This strategy mainly uses the previous trading day's high, low and close prices as the support and resistance levels for the current day. It goes long when the resistance level is broken and goes short when the support level is backtested. It belongs to a typical breakout strategy.
The code first defines a function calculateSupportResistance to calculate the support and resistance levels, which extracts the previous trading day's high, low and close prices as the current day's support and resistance levels.
Then in the main logic, this function is called to get these three price levels and plot them.
In the backtesting logic, if the close price is lower than the previous day's low while the current price is higher than that low forming a breakout, it goes long. If the close price is higher than the previous day's high while the current price is lower than that high forming a breakout, it goes short.
Through this breakout model, the judgment of trend and generation of trading signals are implemented.
-
Use previous trading day's data to build current day's support and resistance levels, avoiding the parameter optimization problem
-
Support and resistance levels come from real market trading data, with some reference value
-
Simple and straightforward backtesting model, easy to understand and implement
-
Visual display of support and resistance levels forms perception of prices
-
Real-time monitoring of breakouts, timely catching trading opportunities
-
Support and resistance levels change over time, hard to determine validity
-
Unable to predict trend direction, risk of missing reversals
-
Easily affected by false breakouts, premature entry risk
-
Unable to determine persistence of breakouts, early stop loss likely
-
Individual support and resistance failure more likely under huge market fluctuation
Countermeasures:
-
Combine more factors to judge validity of breakouts
-
Appropriately expand stop loss range to catch trends
-
Open positions in batches, reduce impact of individual fluctuations
-
Add more historical data like 5-day, 10-day lines to determine levels
-
Incorporate other indicators like volume to judge breakout validity
-
Set stop loss based on actual volatility
-
Optimize capital management, control single loss
Overall this is a typical breakout strategy, simple and intuitive. By building current day's support and resistance with previous day's data and backtesting breakouts of those levels for long/short. Pros are easy to understand and directly visualize levels; cons are false breakout risks and uncertainty of persistence. Next steps are improving breakout validity, controlling risks, optimizing capital management etc.
[/trans]
Source (PineScript)
/*backtest
start: 2024-01-22 00:00:00
end: 2024-02-21 00:00:00
period: 1h
basePeriod: 15m
exchanges: [{"eid":"Futures_Binance","currency":"BTC_USDT"}]
*/

//@version=5
strategy("Support and Resistance with Backtesting", overlay=true)

// Function to calculate support and resistance levels
calculateSupportResistance() =>
    highPrevDay = request.security(syminfo.tickerid, "D", high[1], lookahead=barmerge.lookahead_on)
    lowPrevDay = request.security(syminfo.tickerid, "D", low[1], lookahead=barmerge.lookahead_on)
    closePrevDay = request.security(syminfo.tickerid, "D", close[1], lookahead=barmerge.lookahead_on)
    [highPrevDay, lowPrevDay, closePrevDay]

// Call the function to get support and resistance levels
[supResHigh, supResLow, supResClose] = calculateSupportResistance()

// Plotting support and resistance levels
plot(supResHigh, color=color.red, linewidth=2, title="Previous Day High")
plot(supResLow, color=color.green, linewidth=2, title="Previous Day Low")
plot(supResClose, color=color.blue, linewidth=2, title="Previous Day Close")

// Backtesting logic
backtestCondition = close[1] < supResLow and close > supResLow
strategy.entry("Long", strategy.long, when=backtestCondition)

// Plotting buy/sell arrows for backtesting
plotarrow(backtestCondition ? 1 : na, colorup=color.green, offset=-1, transp=0)
Detail
https://www.fmz.com/strategy/442528
Last Modified
2024-02-22 16:07:14
