Name
动量加速扩展价量趋势策略Extended-Price-Volume-Trend-Strategy
Author
ChaoZhang
Strategy Description
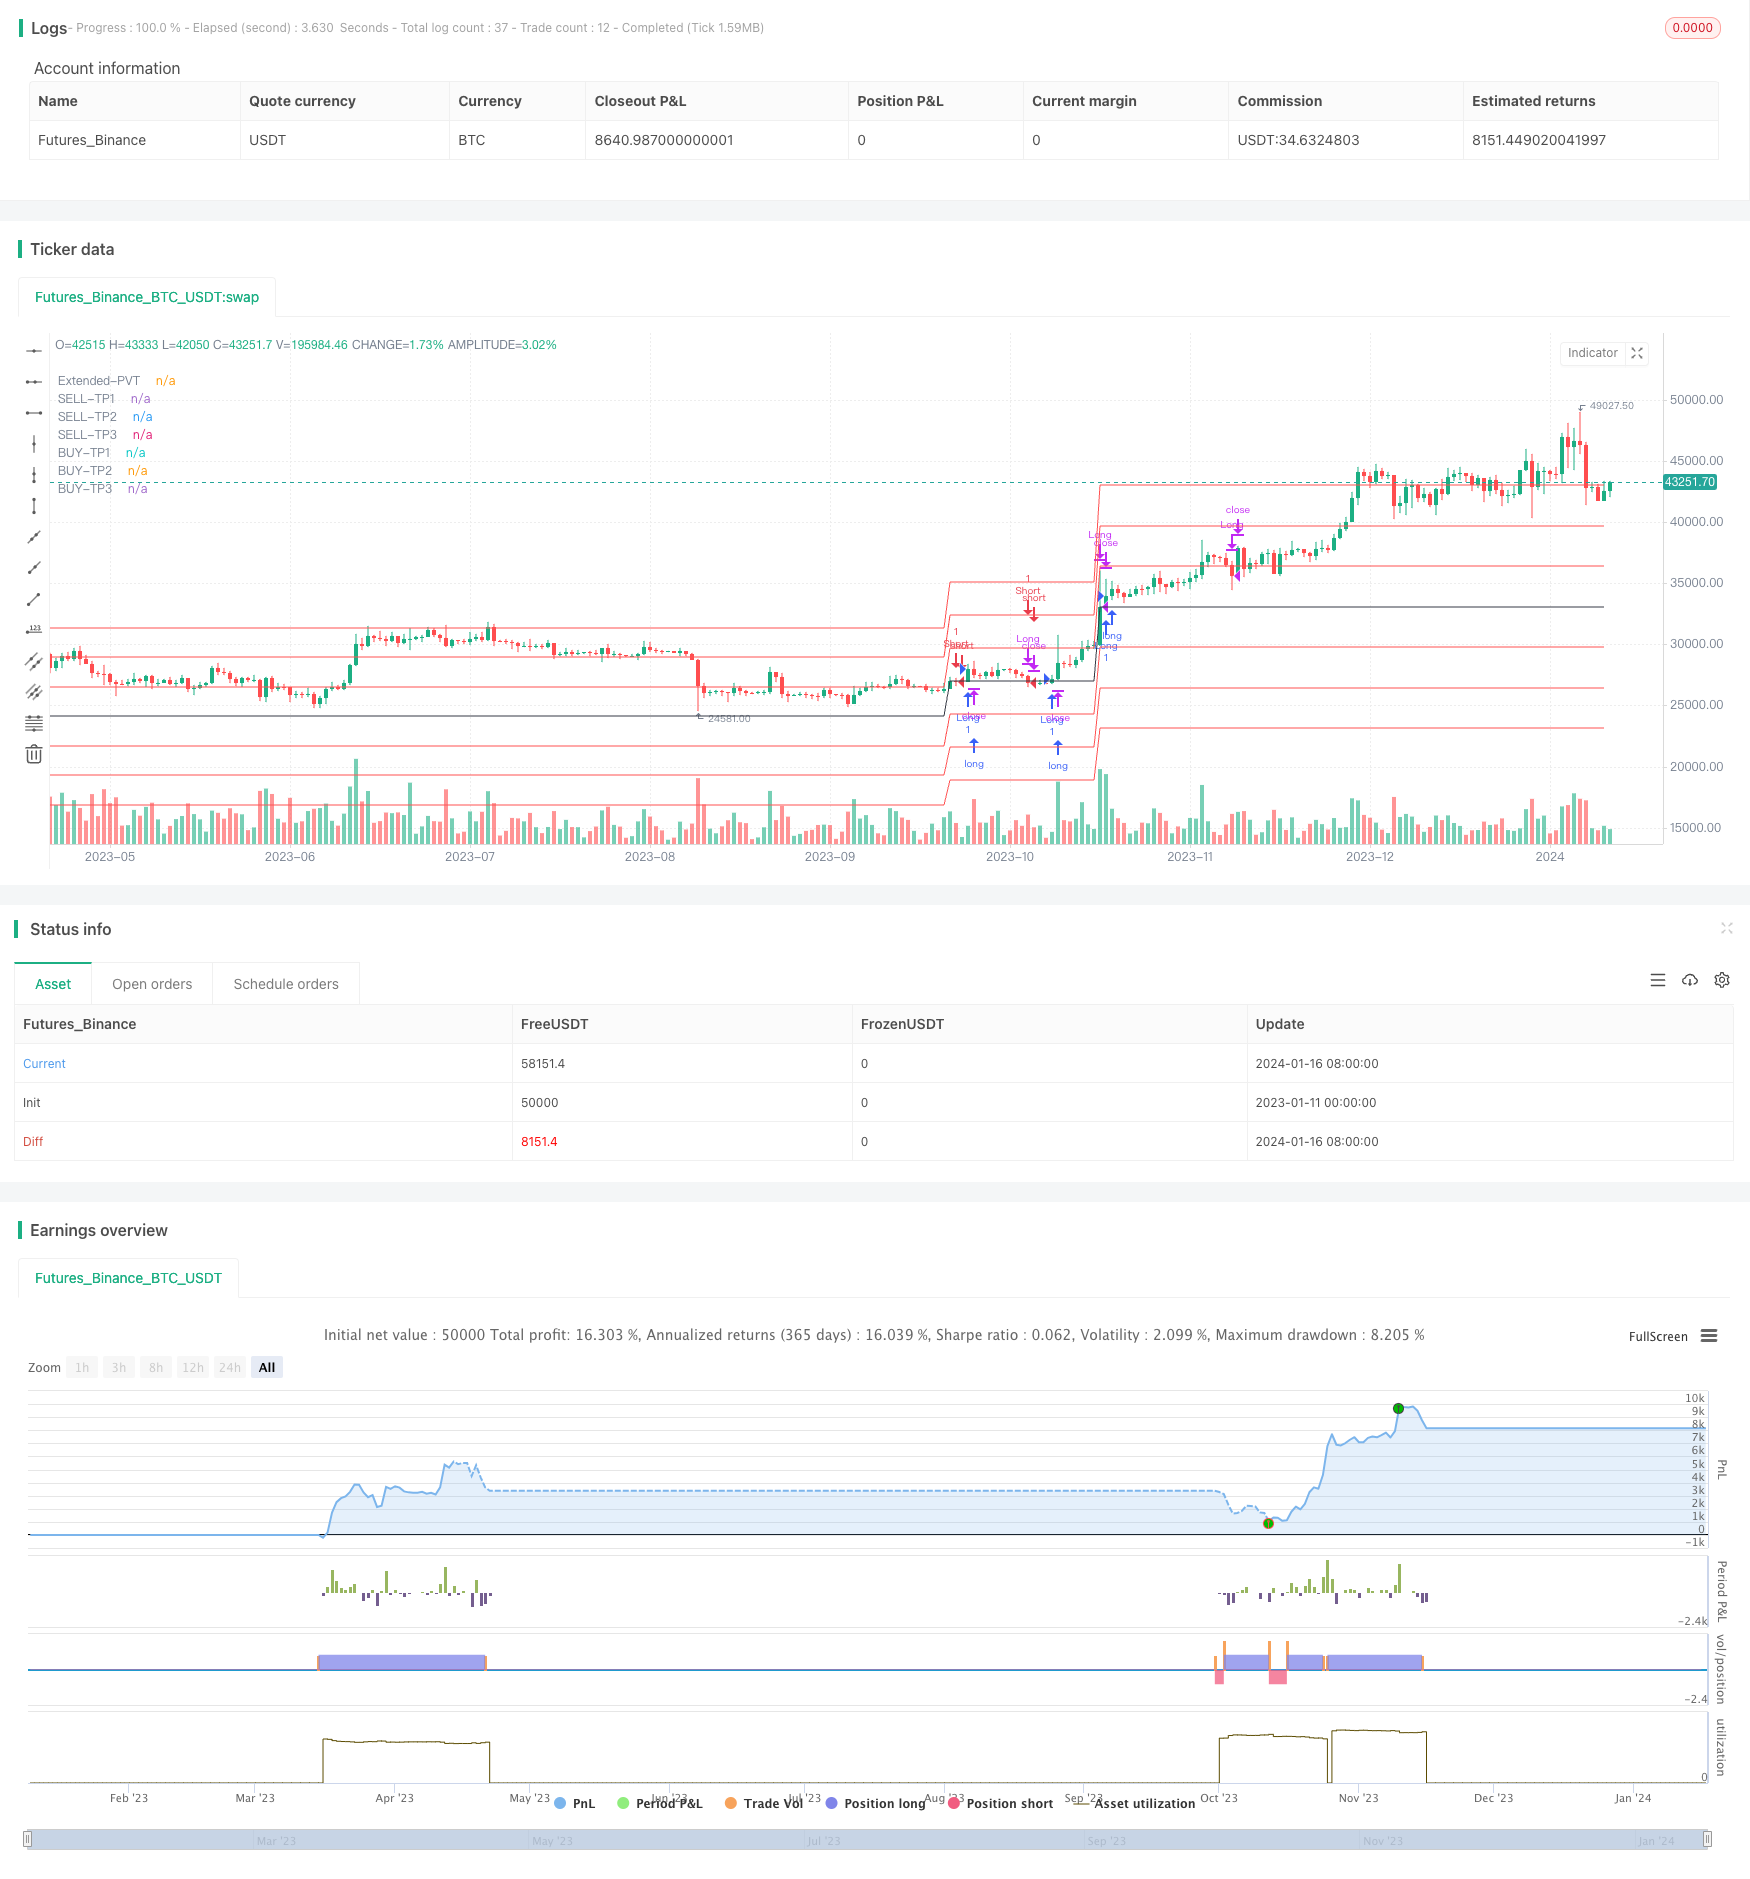
动量加速扩展价量趋势(Extended Price Volume Trend, EPVT)策略是一种技术指标组合策略。它结合了动量加速指标与其他辅助指标,识别潜在的趋势反转点和动量转变时机。
该策略的核心指标是扩展价量趋势(EPVT)。它的计算方法是:累积交易量 * 价格涨跌幅。然后计算一定周期内 EPVT 的最大值与最小值,得到基准区。EPVT 指标曲线即为 EPVT 与该基准区的差值曲线。
当 EPVT 指标曲线向上穿越零轴时,表示买入压力增强,做多信号出现。反之 EPVT 向下穿越零轴时,做空信号出现。
为提高信号质量,策略还辅助使用简单移动平均线,确认趋势转变的可靠性。
该策略结合了趋势、动量和交易量三个维度的指标,能较全面判断市场买卖意愿和力度。使用扩展价量趋势指标,对短期内突发的超量行情有很好的识别作用,可抓住市场的转折点。
设置三档止盈位置离场,可根据自己的风险偏好选择不同的止盈比例。
该策略较依赖指标曲线的形态特征,当走势不典型时会发出错误信号。此外,three bars反转等情况也会导致不必要的反向开仓。
可适当调整参数,或增加其他滤波指标来优化。止损策略也可降低单次损失。
-
参数优化。如调整 EPVT 周期参数,寻找最佳参数组合。
-
增加趋势过滤条件。如在 EPVT 信号基础上,判断价格通道或均线的方向。
-
优化止损策略。如设置固定数值止损或ATR 止损。
动量加速扩展价量趋势策略,通过 EPVT 指标发掘市场买卖意愿的变化,藉此抓住潜在的趋势转折点。设置三档不同比例的止盈出场,可满足投资者不同的风险偏好。该策略值得进一步测试与优化,可成为识别市场短期走势转变的有效工具。
||
The Extended Price Volume Trend (EPVT) strategy is a technical indicator combination strategy. It combines the momentum acceleration indicator with other auxiliary indicators to identify potential trend reversal points and shifts in momentum.
The core indicator of this strategy is the Extended Price Volume Trend (EPVT). Its calculation method is: cumulative trading volume * percentage price change. Then calculate the maximum and minimum values of EPVT over a certain period to obtain the benchmark range. The EPVT indicator curve is the difference curve between EPVT and this benchmark range.
When the EPVT indicator curve crosses above the zero axis, it indicates that buying pressure is increasing and a long signal appears. Conversely, when the EPVT crosses below the zero axis, a short signal appears.
To improve signal quality, the strategy also uses a simple moving average to confirm the reliability of trend changes.
This strategy combines indicators from three dimensions: trend, momentum and trading volume, which can more comprehensively judge market sentiment and intensity. Using the extended price volume trend indicator has a very good identification effect on excessive volume in the short term, and can capture turning points in the market.
Setting three take-profit levels to exit can choose different profit ratios according to your own risk preference.
This strategy relies relatively heavily on the morphology of indicator curves, and will issue false signals when the trend is atypical. In addition, three bars reversals and other situations will also lead to unnecessary reverse opening of positions.
Parameters can be adjusted appropriately or other filtering indicators can be added to optimize. A stop loss strategy can also reduce single losses.
-
Parameter optimization. Such as adjusting the cycle parameter of EPVT to find the optimal parameter combination.
-
Add trend filtering conditions. Such as judging the direction of the price channel or moving average based on the EPVT signal.
-
Optimize stop loss strategies. Such as setting fixed value stops or ATR stops.
The momentum acceleration extended price volume trend strategy captures changes in market sentiment through the EPVT indicator, taking advantage of potential trend turning points. Setting three take-profit levels of different ratios allows to meet different risk appetites of investors. This strategy is worth further testing and optimization to become an effective tool for identifying short-term trend changes in the market.
[/trans]
Strategy Arguments
| Argument | Default | Description |
|---|---|---|
| v_input_1 | 200 | Trend Lenght |
| v_input_int_1 | 10 | TP-1 |
| v_input_int_2 | 20 | TP-2 |
| v_input_int_3 | 30 | TP-3 |
Source (PineScript)
/*backtest
start: 2023-01-11 00:00:00
end: 2024-01-17 00:00:00
period: 1d
basePeriod: 1h
exchanges: [{"eid":"Futures_Binance","currency":"BTC_USDT"}]
*/

//@version=5
strategy(title="Extended Price Volume Trend", overlay=true )//@version=5
var cumVol = 0.
cumVol += nz(volume)
if barstate.islast and cumVol == 0
    runtime.error("No volume is provided by the data vendor.")
src = close
lenght = input(200,"Trend Lenght")
vt = ta.cum(ta.change(src)/src[1]*volume)
upx = ta.highest(vt,lenght)
downx = ta.lowest(vt,lenght)
basex = (upx +downx)/2
VTX = vt - basex
VTY = ta.valuewhen(ta.cross(VTX,0),close,0)
plot(VTY, color=color.black, title="Extended-PVT")

/////////////////////// STRATEGY ////////////////
/////////////////////// TAKE PROFIT SECTION ////////////////
longConditionx = ta.crossover(close,VTY)
ShortConditionx = ta.crossunder(close,VTY)
tp1 = input.int(10, minval=1,title = "TP-1")
tp2 = input.int(20, minval=1,title = "TP-2")
tp3 = input.int(30, minval=1,title = "TP-3")

ematp = ta.ema(close,2)
TPTAKA1S = VTY*(1-tp1/100)
plot(TPTAKA1S, "SELL-TP1", color=color.red,linewidth = 1)
TPTAKA2S = VTY*(1-tp2/100)
plot(TPTAKA2S, "SELL-TP2", color=color.red,linewidth = 1)
TPTAKA3S = VTY*(1-tp3/100)
plot(TPTAKA3S, "SELL-TP3", color=color.red,linewidth = 1)

TPTAKA1B = VTY*(1+tp1/100)
plot(TPTAKA1B, "BUY-TP1", color=color.red,linewidth = 1)
TPTAKA2B = VTY*(1+tp2/100)
plot(TPTAKA2B, "BUY-TP2", color=color.red,linewidth = 1)
TPTAKA3B = VTY*(1+tp3/100)
plot(TPTAKA3B, "BUY-TP3", color=color.red,linewidth = 1)

BUYTP = ta.crossunder(close,VTY) or ta.crossunder(ematp,TPTAKA1B) or ta.crossunder(ematp,TPTAKA2B) or ta.crossunder(ematp,TPTAKA3B)
SELLTP = ta.crossover(close,VTY) or ta.crossover(ematp,TPTAKA1S) or ta.crossover(ematp,TPTAKA2S) or ta.crossover(ematp,TPTAKA3S)
/////////////////////// STRATEGY ////////////////
// Check for Long Entry
longCondition = longConditionx==true
if longCondition
    strategy.entry('Long', strategy.long, comment = "ENTER-LONG")

buyclose = ShortConditionx==true or BUYTP==true
// Exit condition
strategy.close('Long', when=buyclose or BUYTP==true, comment = "EXIT-LONG")

// Check for Short Entry
ShortCondition = ShortConditionx==true
if ShortCondition
    strategy.entry('Short', strategy.short, comment = "ENTER-SHORT")

sellclose = longConditionx==true or SELLTP ==true
// Exit condition
strategy.close('Short', when=sellclose or SELLTP==true, comment = "EXIT-SHORT")
///// END OF STRATEGY ///////////
Detail
https://www.fmz.com/strategy/439272
Last Modified
2024-01-18 16:32:28
