Name
刚性突破策略Stiffness-Breakthrough-Strategy
Author
ChaoZhang
Strategy Description
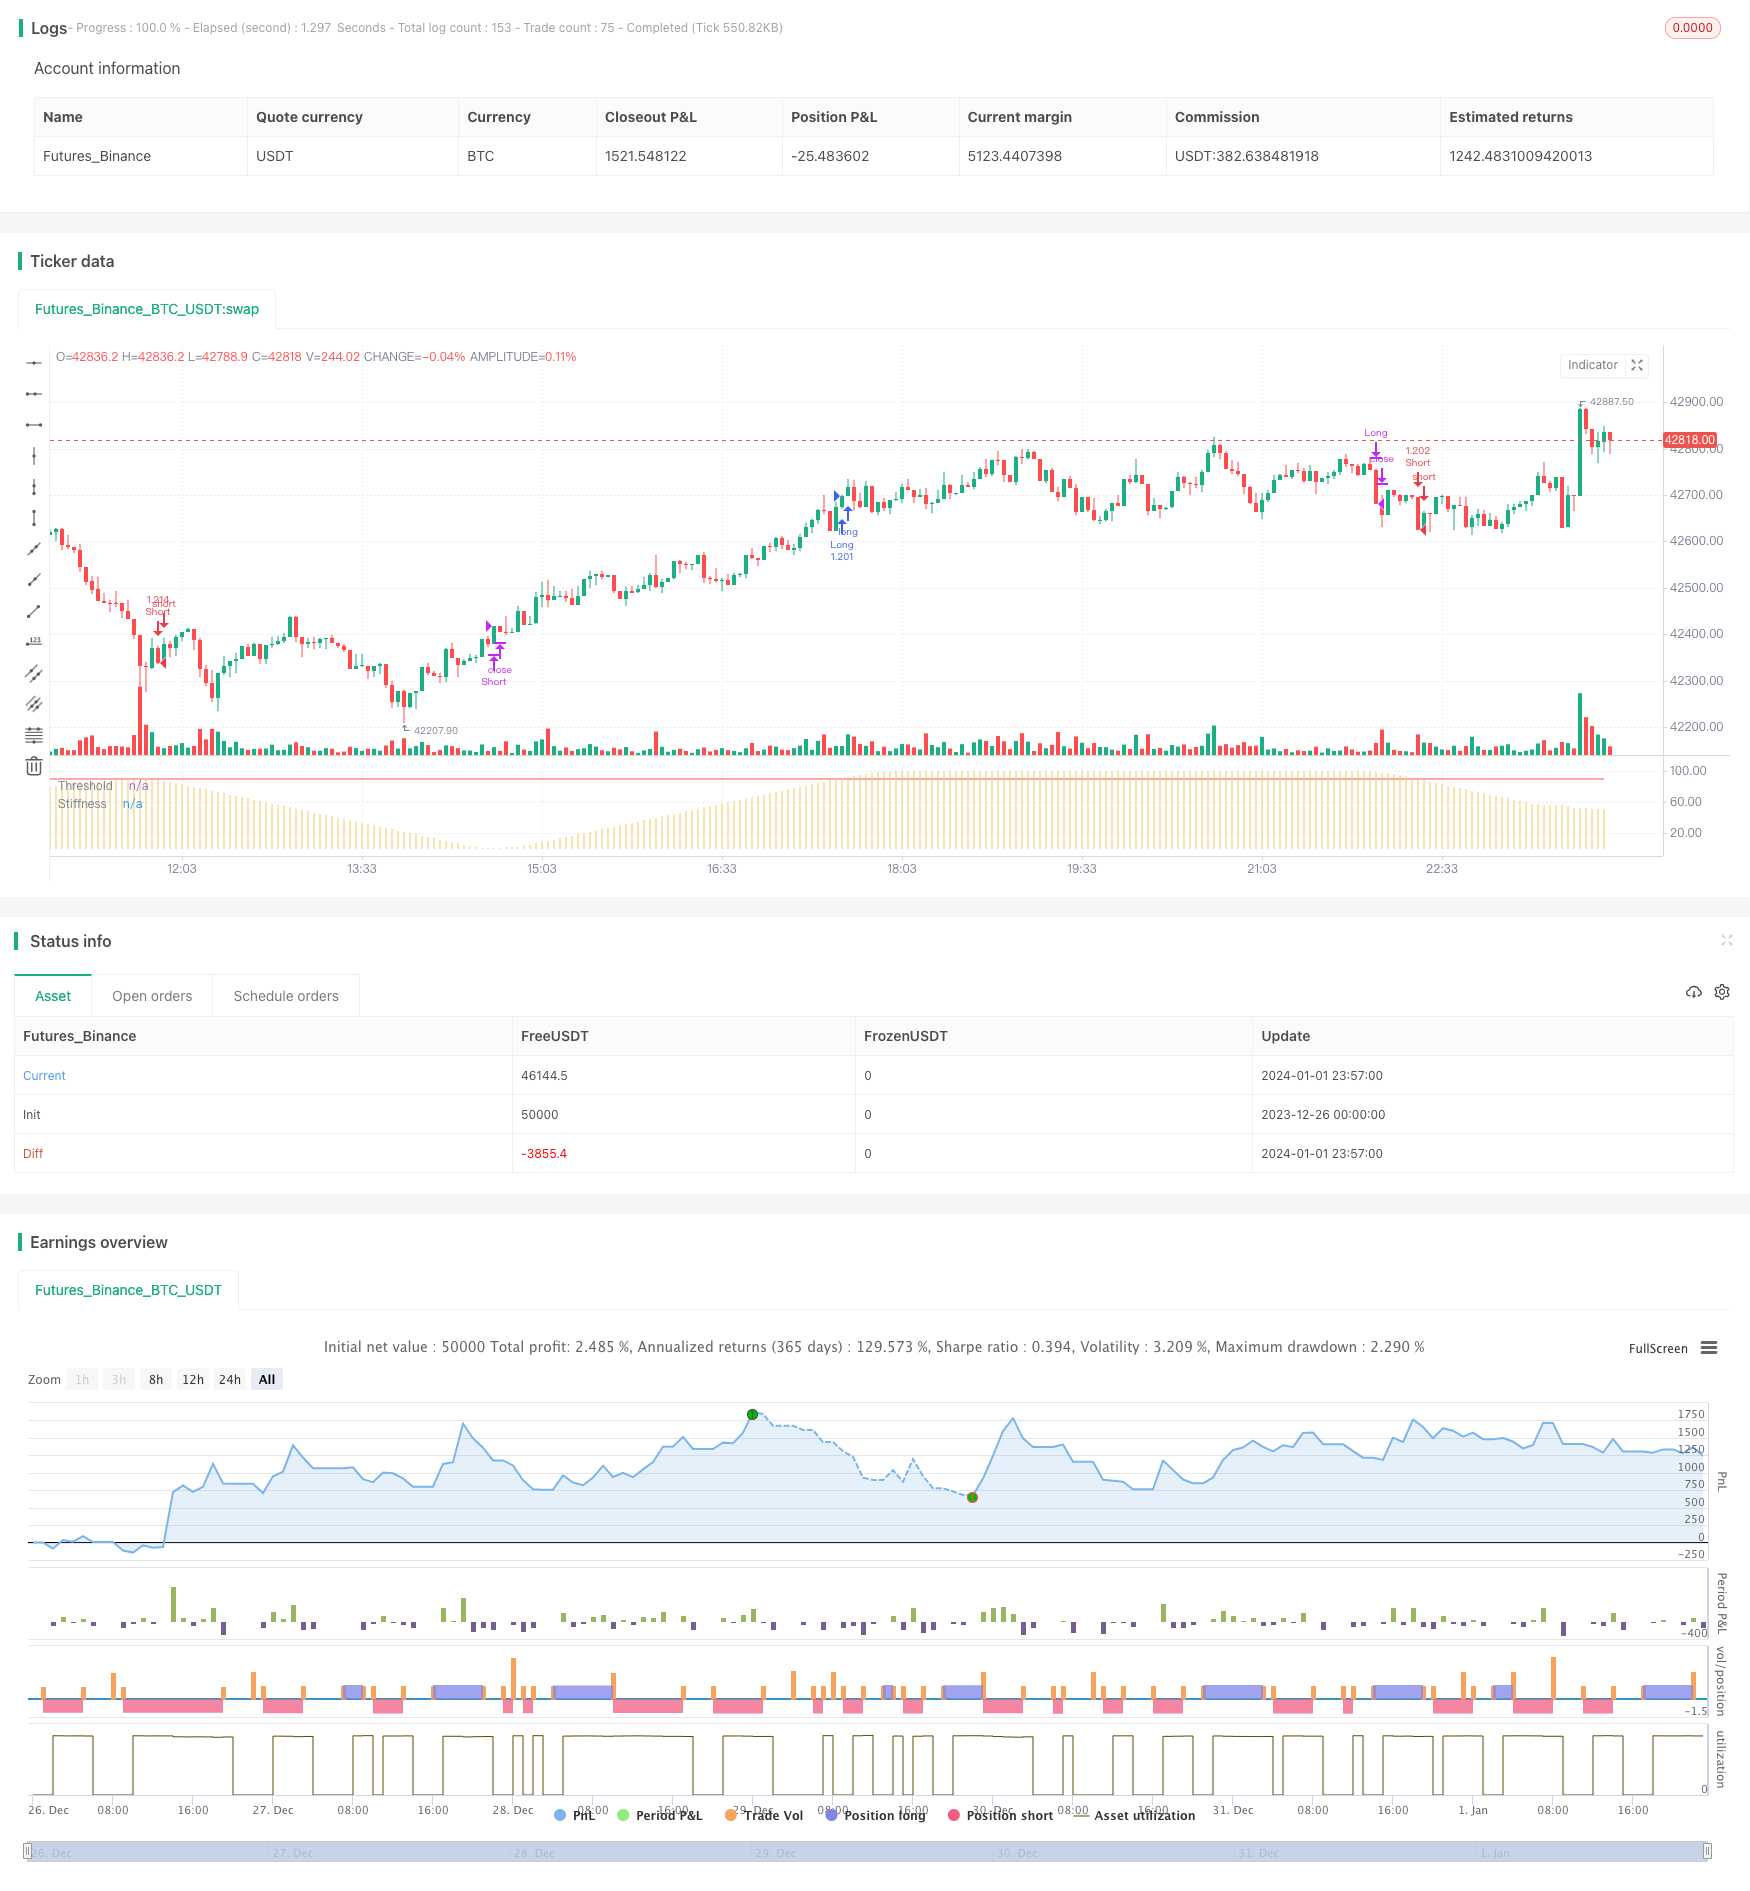
刚性突破策略是一种基于价格刚性指标的突破策略。它通过计算一定周期内收盘价突破上轨的次数,来判断价格的刚性。当刚性指标超过设定阈值时,判断行情即将突破,进行买入操作;当刚性指标低于阈值时,判断行情即将回落,进行卖出操作。
-
计算均线和标准差:首先计算n周期的简单移动平均线作为基准上轨,然后计算价格标准差的0.2倍作为下轨的缓冲。
-
计算刚性指标:统计m周期内收盘价高于上轨的天数,除以m得到0-100的值,再用n周期EMA平滑,得到最终的刚性值,表示价格突破上轨的概率。
-
比较刚性与阈值:当刚性指标上穿设定阈值时,表明突破概率增加,产生买入信号;当刚性指标下穿阈值时,表明突破概率下降,产生卖出信号。
-
进场和出场:收盘价突破上轨时买入,突破失败开始下跌时卖出。做多突破的同时,也可做空回调。
-
捕捉突破的时机: relativel比较可靠地判断趋势是否即将出现突破或回调的时机,从而提前进入场内。
-
兼顾突破与回调: 该策略同时利用刚性指标的突破与回落,实现做多和做空机会的捕捉。
-
参数灵活: 用户可以根据市场调整均线长度、刚性周期、阈值等参数,适应不同周期和市场的特征。
-
实现简单: 仅利用刚性指标和阈值比较,没有复杂逻辑,代码实现较为简洁。
-
突破失败风险: 刚性超过阈值时,并不能完全保证价格会突破上轨,存在一定的假突破风险。
-
回调范围风险: 做空时无法预测具体的回调范围和位置,存在亏损过多的风险。
-
参数优化风险: 参考参数无法完全适应市场的变化,需要根据实际情况不断测试和优化。
-
频繁交易风险: 该策略交易频率较高,会增加交易成本和滑点的损耗。
-
优化参数: 可以测试不同市场下的参数设置,寻找最佳参数组合。比如增加均线长度来降低交易频率等。
-
加入止损: 设置合理的止损逻辑,来控制单笔亏损。可以根据atr 来设置止损位。
-
结合其他指标: 可以加入类似MACD,KD等指标来决定具体的入场点位,减少假突破的概率。
-
优化出场条件: 可以基于趋势指标等确定趋势反转的特征,设置更加准确的出场条件。
刚性突破策略整体来说较为简单实用。它可以提前判断价格可能的突破和回落时机,具有一定的实用价值。但我们也需要注意假突破和回调范围的问题,通过参数优化和加入其他technical指标来锁定更精准的交易机会。
||
Stiffness Breakthrough Strategy is a breakout strategy based on the price stiffness indicator. It calculates the number of times the closing price breaks through the upper rail over a certain period to determine the stiffness of the price. When the stiffness indicator exceeds the set threshold, it is judged that the market is about to break out and a buy order is placed. When the stiffness indicator is below the threshold, it is judged that the market is about to fall back and a sell order is placed.
-
Calculate Moving Average and Standard Deviation: Calculate the simple moving average of n periods as the benchmark upper rail, and 0.2 times the standard deviation of the price as the buffer lower rail.
-
Calculate Stiffness Indicator: Count the number of days when the closing price is higher than the upper rail in m cycles, divide by m to get a value between 0-100, and then smooth it with a n-period EMA to get the final stiffness value, representing the probability that the closing price will break through the upper rail.
-
Compare Stiffness and Threshold: When the stiffness indicator crosses above the set threshold, it means that the probability of breakthrough increases and a buy signal is generated. When the stiffness indicator crosses below the threshold, it means that the probability of breakthrough decreases and a sell signal is generated.
-
Entry and Exit: Buy when the closing price breaks through the upper rail, and sell when the breakthrough fails and the decline begins. Going long on breakouts while also going short on pullbacks.
-
Capture the timing of breakouts: Relatively reliably judge when a trend is about to break out or pull back, so as to enter the market in advance.
-
Take into account breakouts and pullbacks: The strategy captures both long and short opportunities by utilizing stiffness indicator breakouts and declines.
-
Flexible parameters: Users can adjust parameters such as moving average length, stiffness cycle, threshold, etc. according to the market to adapt to the characteristics of different cycles and markets.
-
Simple to implement: Only use stiffness indicator and threshold comparison without complex logic, code implementation is quite simple.
-
Failed breakout risk: When stiffness exceeds the threshold, it cannot be fully guaranteed that prices will break through the upper rail, with a certain risk of false breakouts.
-
Pullback range risk: When going short, the specific range and location of pullbacks cannot be predicted, with the risk of losing too much.
-
Parameter optimization risk: Reference parameters cannot fully adapt to market changes, and need to be continuously tested and optimized according to actual conditions.
-
Frequent trading risk: The relatively high trading frequency of this strategy increases the loss from trading costs and slippage.
-
Optimize parameters: Test parameter settings under different markets to find the optimal parameter combination. For example, increase the moving average length to reduce trading frequency.
-
Add stop loss: Set reasonable stop loss logic to control single loss. Stop loss can be set based on ATR.
-
Incorporate other indicators: Indicators such as MACD and KD can be added to determine specific entry points and reduce the probability of false breakouts.
-
Optimize exit conditions: Trend indicators can be used to determine the characteristics of trend reversals and set more accurate exit conditions.
Overall, the Stiffness Breakthrough Strategy is quite simple and practical. It can predict possible price breakouts and pullbacks in advance, with some practical value. But we also need to pay attention to the issues of false breakouts and pullback range, and capture more accurate trading opportunities through parameter optimization and the addition of other technical indicators.
[/trans]
Strategy Arguments
| Argument | Default | Description |
|---|---|---|
| v_input_1 | 100 | Moving Average Length |
| v_input_2 | 60 | Stiffness Length |
| v_input_3 | 3 | Stiffness Smoothing Length |
| v_input_4 | 90 | Threshold |
| v_input_5 | false | Highlight Threshold Crossovers ? |
Source (PineScript)
/*backtest
start: 2023-12-26 00:00:00
end: 2024-01-02 00:00:00
period: 3m
basePeriod: 1m
exchanges: [{"eid":"Futures_Binance","currency":"BTC_USDT"}]
*/

//@version=4
// Copyright (c) 2020-present, JMOZ (1337.ltd)
// Copyright (c) 2018-present, Alex Orekhov (everget)
// Stiffness Indicator script may be freely distributed under the MIT license.
strategy("Stiffness Strategy", overlay=false, initial_capital=10000, default_qty_type=strategy.percent_of_equity, default_qty_value=100, commission_value=0.075)


maLength = input(title="Moving Average Length", minval=1, defval=100)
stiffLength = input(title="Stiffness Length", minval=1, defval=60)
stiffSmooth = input(title="Stiffness Smoothing Length", minval=1, defval=3)
threshold = input(title="Threshold", minval=1, defval=90)
highlightThresholdCrossovers = input(title="Highlight Threshold Crossovers ?", type=input.bool, defval=false)


bound = sma(close, maLength) - 0.2 * stdev(close, maLength)
sumAbove = sum(close > bound ? 1 : 0, stiffLength)
stiffness = ema(sumAbove * 100 / stiffLength, stiffSmooth)


long_cond = crossover(stiffness, threshold)
long_close = stiffness > threshold and falling(stiffness, 1)
short_cond = crossunder(stiffness, threshold) or stiffness < threshold and falling(stiffness, 1)
short_close = stiffness < threshold and rising(stiffness, 1)


strategy.entry("Long", strategy.long, when=long_cond)
strategy.close("Long", when=long_close)
strategy.entry("Short", strategy.short, when=short_cond)
strategy.close("Short", when=short_close)


transparent = color.new(color.white, 100)

bgColor = highlightThresholdCrossovers ? stiffness > threshold ? #0ebb23 : color.red : transparent
bgcolor(bgColor, transp=90)

plot(stiffness, title="Stiffness", style=plot.style_histogram, color=#f5c75e, transp=0)
plot(threshold, title="Threshold", color=color.red, transp=0)
Detail
https://www.fmz.com/strategy/437494
Last Modified
2024-01-03 11:34:34
