-
Notifications
You must be signed in to change notification settings - Fork 22
New issue
Have a question about this project? Sign up for a free GitHub account to open an issue and contact its maintainers and the community.
By clicking “Sign up for GitHub”, you agree to our terms of service and privacy statement. We’ll occasionally send you account related emails.
Already on GitHub? Sign in to your account
GUI should support directed graphs and multigraphs #31
Comments
|
Supporting multigraphs is tricky, because the most widely used approach is to draw every edge separately . This could be implemented in evoplex in the following way:
This obviously doesn't scale well since:
If multigraphs are supported, we could colour-code the edges to indicate whenever more than one edge is present. We could use virtually any convergent series, to calculate the gradient of a given edge. For example, let's say we have two nodes connected by three edges. We then calculate then gradient of the green channel using any convergent series (here we'll use the reciprocals of Triangular numbers). Here the resulting colour will be |
Yes, you're right.
That's a good solution indeed. However, the problem is that we already use colours to distinguish the edge attributes (just as we do for the nodes). Another potential solution may be to set the thickness 🤔 |
|
That's great @Sedictious
Yes, make sure the size of the arrow is proportional to the edge thickness; in this way, we "ensure" that things will work well when zooming in/out, or when the user manually sets the edge thickness in the graph settings. |
|
@cardinot That sounds good! I can't push yet since the implementation is a bit hack-y, but I initially made the arrow size proportional to the edgeScale. I don't know whether my solution is optimal, but I did get this by calculating the normal direction vector connecting the two nodes
and then a temporary point somewhere on the edge
All that remains for calculating the other 2 points that make up the arrow, is to rotate |
|
The strategy looks good. However, it might be easier to give some thoughts on optimization after being able to check the whole thing. |
Currently, the graph widget draws all graphs as a simple and undirected graph.
It would be nice to have a way to distinguish simple graphs, digraphs and multigraphs.
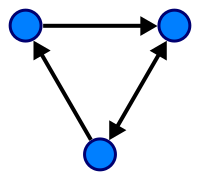
For instance, a digraph should show the arrows to indicate the direction of the links as in the example below:

However, we should keep in mind that any change in the way how we draw things can drastically affect the performance of the GUI.
For instance, in the case of a multigraph, in order to change the style of a second edge, we'd have to keep track of the first edge, or "predict" that two or more edges will have to be drawn etc. So, we need to ensure that those operations do not add an extra and unnecessary cost to the simplest and most common scenario, i.e., simple undirected graph. On the contrary case, we could extend the base classes and implement an optimized version for multigraphs. Then, in the GUI, the user could choose which widget they wish to open, i.e., undirected graph style, directed style or multigraph style 😃
Thanks @Sedictious for raising this issue.
The text was updated successfully, but these errors were encountered: